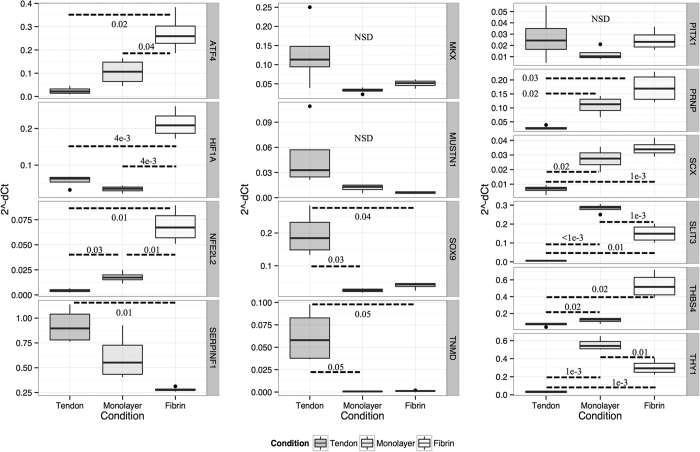
Figure 3. Box-and-whisker plots showing the distribution of normalised and transformed cycle threshold qPCR values (y-axis, 2^-dCt) for three experimental conditions (x-axis, tendon | monolayer | fibrin cultures) for selected genes (vertical legends).
Box and whisker plots show mean, first and third quartiles, and maximum and minimum values. Results for technical triplicates on n = 4 biological replicates. Results of hypothesis testing (p-values) for differences between groups, after post-hoc corrections, are shown where thresholds are met; NSD – no significant difference.

