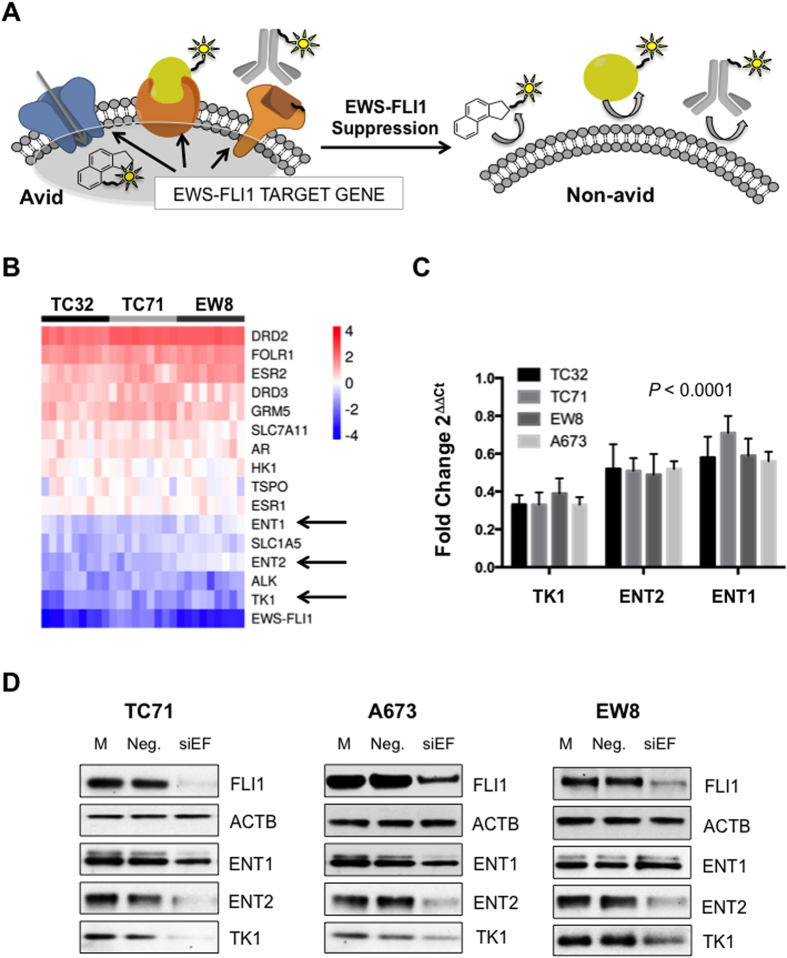
Figure 1. Identification of 18F-FLT as a pharmacodynamic marker of EWS-FLI1 activity.
(A) Schema showing theory of study. Suppression of an EWS-FLI1 target expressed on the cell surface will allow quantitation of EWS-FLI1 activity based on loss of transport of a labeled substrate or loss of binding of a labeled antibody or ligand. (B) Heat map summarizing screen results. EWS-FLI1 was silenced in three different cell lines (TC32, TC71 and EW8) and the induction (red) or suppression (blue) of expression was measured by qPCR. ENT1, ENT2, and TK1 (arrows) were all suppressed with silencing of EWS-FLI1. (C) Confirmatory PCR in 4 cell lines showing suppression of ENT1, ENT2, and TK1 with siRNA silencing of EWS-FLI1 as measured by qPCR. (P for all treatments vs. no change) (D) Western blots confirm suppression of ENT1, ENT2, and TK1 with siRNA silencing of EWS-FLI1.

