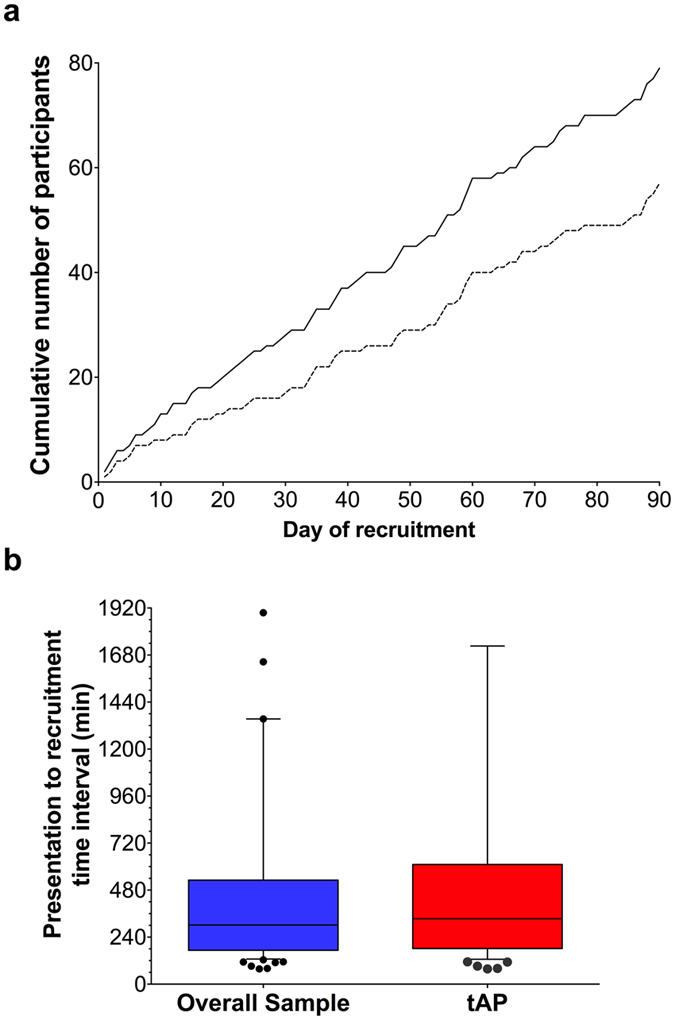
Figure 3.

(a) Cumulative number of enrolled participants per calendar day of the recruitment phase of the study. Solid line: overall study participants; dashed line; tAP participants. (b) Box & whiskers plot of the time interval from patient presentation to hospital to study recruitment, in minutes. Blue box: overall study participants; red box tAP participants. Boxes: 1st and 3rd quartile; horizontal lines: median values; error bars:1st and 9th deciles; dots: outlying values beyond 1st and 9th decile.
