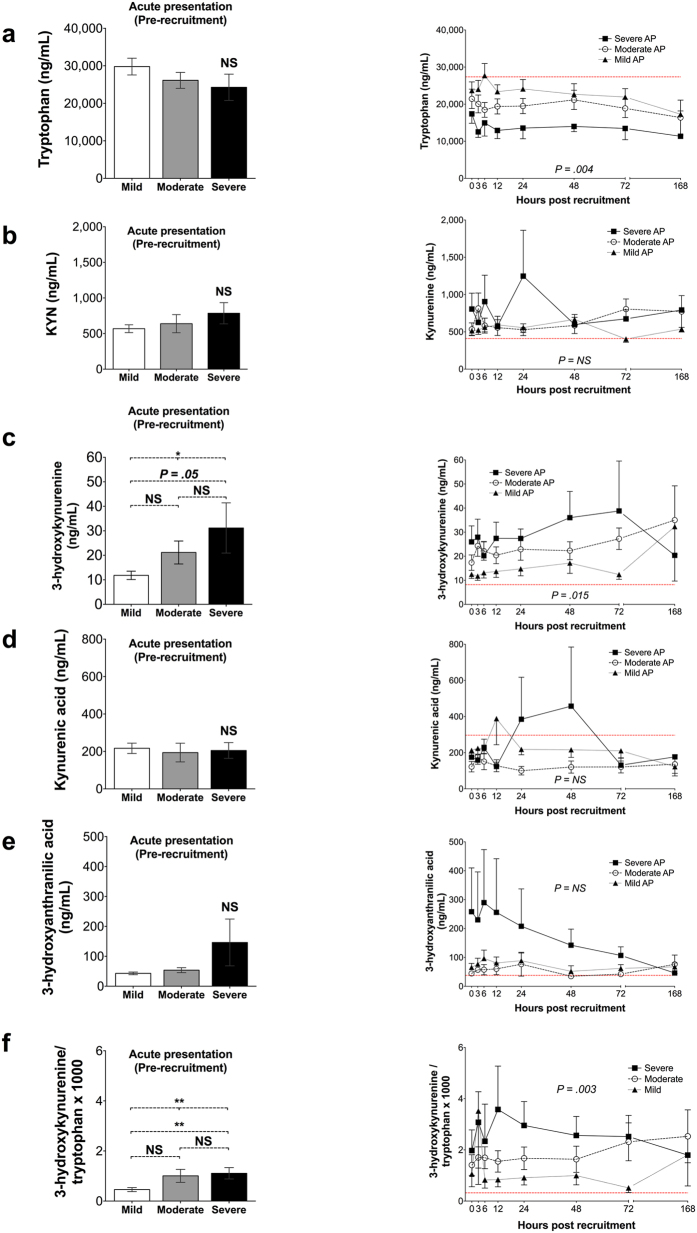
Figure 5. Plasma concentrations of tryptophan and the kynurenine pathway metabolites in tAP participants over time, grouped by AP severity according to the revised Atlanta criteria (group sizes at recruitment: mild n = 25; moderate n = 23; severe n = 9 individuals).
(a) Tryptophan; (b) Kynurenine; (c) 3-hydroxykynurenine; (d) Kynurenic acid; (e) 3-hydroxyanthranilic acid; (f) 3-hydroxykynurenine to tryptophan ratio multiplied by 1000. For all panels, data points represent means and error bars represent standard errors of the mean. P-values for between-group comparisons of standardised AUC are appended. NS: not statistically significant. Dashed red lines represent healthy volunteer (n = 8) mean concentration of each metabolite.

