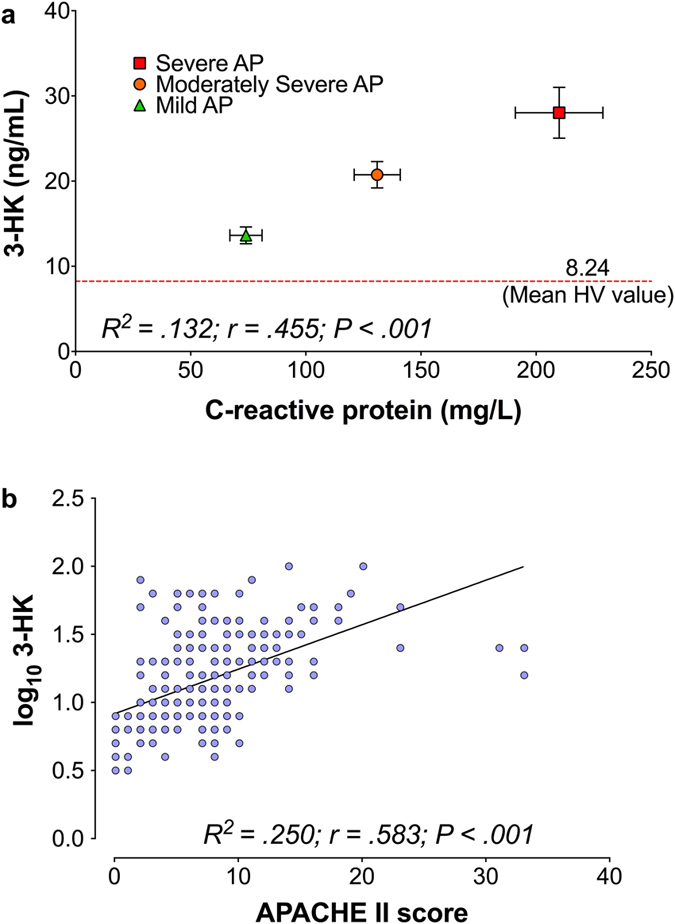
Figure 6.

Dot-plots of correlations between (a) Plasma concentrations of C-reactive protein and 3-hydroxykynurenine, for the tAP cohort grouped by AP severity (mild AP n = 25; moderate AP n = 23; severe AP n = 9). Data points represent means; error bars show standard deviation on both axes. The dashed red line represents mean 3-hydroxykynurenine plasma concentration in healthy volunteers (n = 8). (b) APACHE II score and contemporaneous log10 3-hydroxykynurenine plasma concentrations. Due to the non-normal distribution of plasma concentrations of of 3-hydroxykynurenine, a logarithmic transformation was used for the correlation to provide a better fit. For both correlations, results from samples obtained from T0 up to and including T48 were analysed. Results of respective Spearman correlations have been appended on each figure of the panel.
