Figure 5.
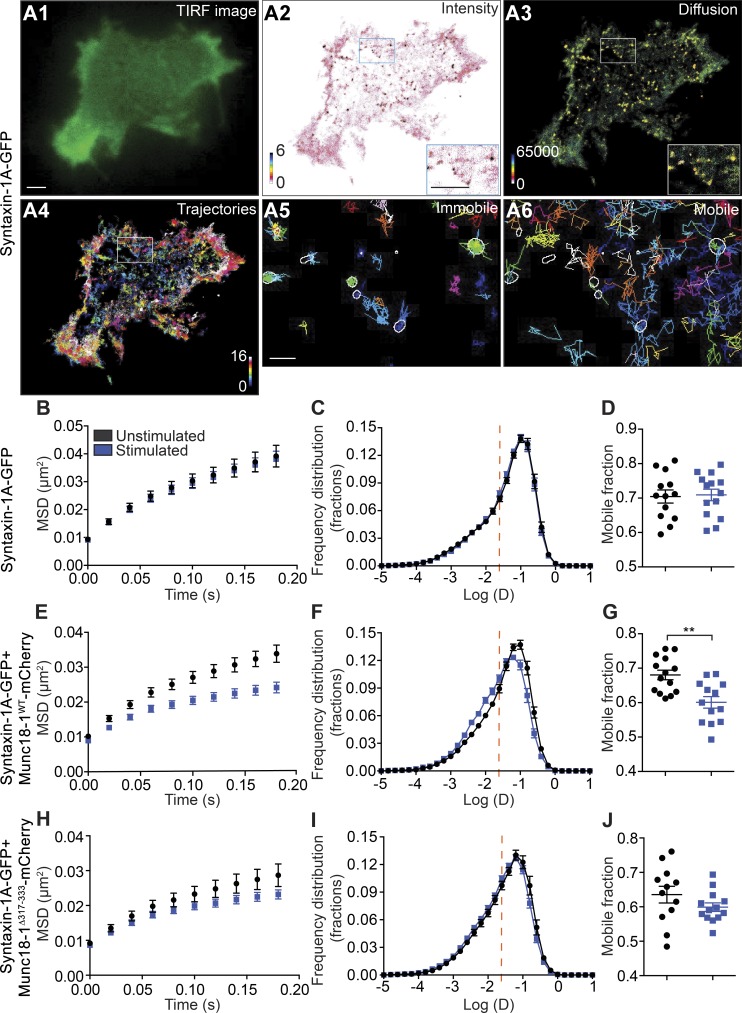
The Munc18-1 domain 3a hinge-loop controls an activity-dependent decrease in syntaxin-1A mobility. DKD-PC12 cells expressing syntaxin-1A-GFP alone or with either Munc18-1WT-mCherry or Munc18-1Δ317-333-mCherry were imaged at 50 Hz (16,000 frames) in either unstimulated or stimulated (2 mM Ba2+) conditions using the uPAINT technique. (A) TIRF image (A1), spt-PALM mean intensity map (A2), and diffusion coefficient map (A3) of a DKD-PC12 cell (detections range from 10−5 to 101 µm2/s) and trajectory maps (A4) calculated from 16,000 images (trajectory color-coding in arbitrary units). (A5 and A6) Nanodomains of syntaxin-1A-GFP from the mean intensity map (outlined) were overlaid with low-mobility and freely diffusing trajectories. Nanodomains preferentially contain low-mobility molecules. Bars: 1 µm; (insets) 22 nm. (B–J) Mean MSD as a function of time, mean distribution of the diffusion coefficients, and the mobile fraction in indicated cells and conditions (n = 12–14 cells for each condition). Sidak–Bonferroni adjustments were made while performing multiple t test comparisons of mobile fractions (**, P < 0.01). Mean ± SEM.

