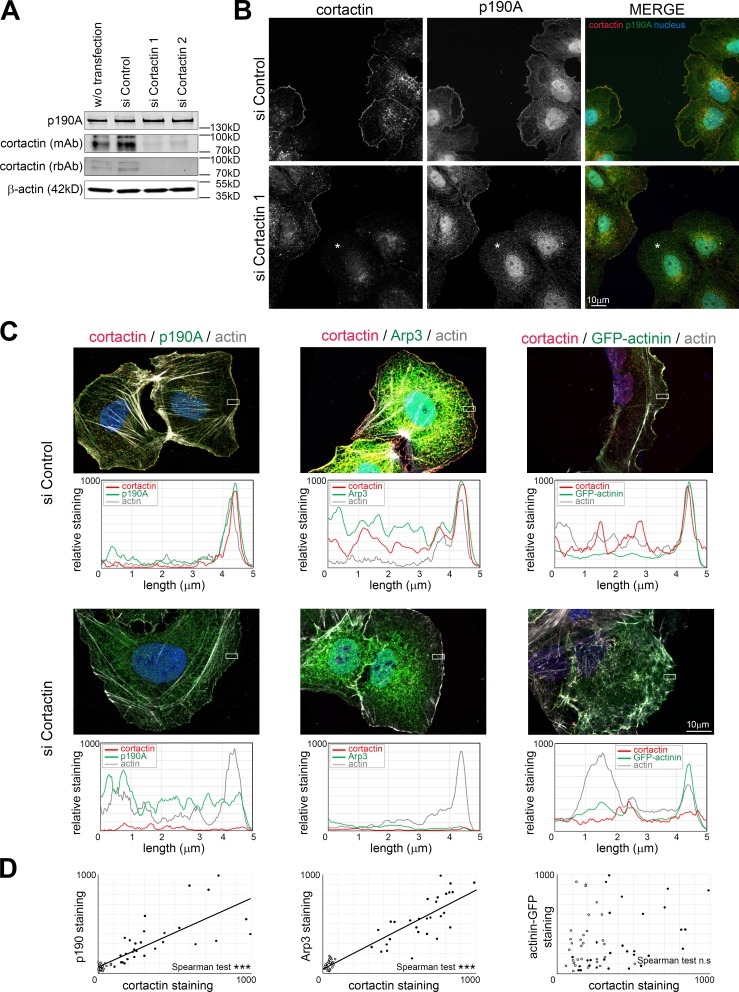
Figure 4.
Cortactin recruits p190A to the lamellipodium’s edge. Huh7 cells were transfected with control siRNA (siControl) or siRNA targeting cortactin (siCortactin1 and 2) and treated with 100 µM C8N6-BPA to induce lamellipodia growth. (A) The expression of endogenous p190A and cortactin was assayed by immunoblotting with an anti-p190A antibody and two antibodies from different species (mAb from mouse and rbAb from rabbit) against cortactin. β-Actin is used as a loading control. (B) Immunofluorescence staining of cortactin (red) and endogenous p190A (green) was performed on Huh7 cells transfected with siControl or siCortactin1. Asterisk indicates cells with absence of cortactin staining. (C) Huh7 cells transfected with siControl or siCortactin1 were immunostained as indicated on each panel. Graphs under each panel represent the quantification of the relative staining of cortactin (red), actin (gray), and p190A, Arp3, or α-actinin–GFP (green) determined inside the white rectangle of 2 × 5 µm. Results are expressed as mean value of the height. (D) Correlation of cortactin staining with p190A, Arp3, and α-actinin–GFP at the lamellipodium edge. Mean values of membrane areas of 2 × 0.28 µm are plotted on the graph. Closed and open circles represent measurement in cells transfected with control siRNA and siCortactin1, respectively (n = 30/condition). Linear regression is presented when Spearman correlation is significant. ***, P < 0.001; n.s, not significant.

