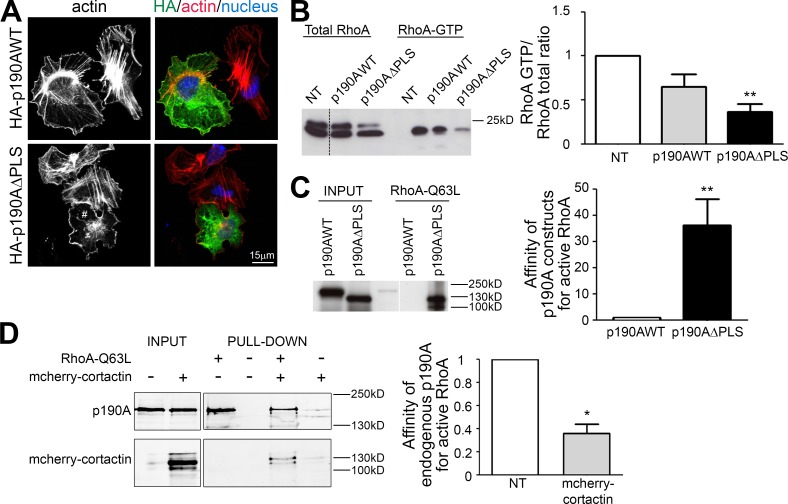
Figure 5.
Regulation of p190A GAP activity. (A) Huh7 cells expressing p190AWT or p190AΔPLS were plated for 3 h on fibronectin and stained for HA (green), F-actin (red, phalloidin), and nuclei (blue, Hoechst). # indicates a cell without stress fibers. (B) Huh7 cells transfected with p190AWT or p190AΔPLS were used for a RhoA GTPase pulldown assay using GST-Rhotekin. RhoA is detected using an anti-RhoA antibody. Quantification of RhoA activity is represented as a histogram. (C) Huh7 cells were transfected with p190AWT or p190AΔPLS. Affinity purification of Huh7 cell lysate was performed with GST-RhoAQ63L and analyzed by immunoblot using anti-HA antibodies. Quantification of the affinity between p190A and active RhoA is represented as a histogram. (D) Huh7 cells were transfected or not (NT) with mcherry-cortactin. Affinity purification on Huh7 cell lysate was performed with GST-RhoAQ63L and analyzed with anti-p190A antibodies. Quantification of the affinity between endogenous p190A and active RhoA is represented as a histogram. On graphs, values were calculated by measuring the band intensity of pulldown/input and are represented as the mean ± SEM of three independent experiments. P-values from the ANOVA (B) or the unpaired t test (C and D) are indicated. *, P < 0.05; **, P < 0.01.

