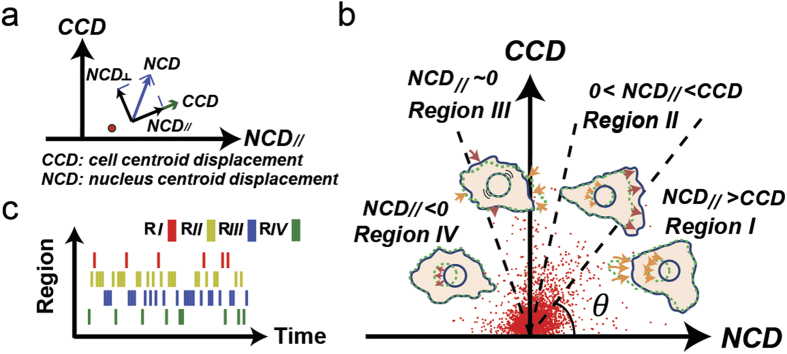
Figure 1. Correlations between cell and nucleus displacements can describe subcellular activities of cell migration.
(a) The CN correlation data point (red dot) locates the correlation between a CCD and a coupled NCD// (projection of nucleus centroid displacement in the CCD direction) in a CCD vs. NCD// plot. (b) Four separate regions (separated by dash lines at 45°, 75°, and 105°) in the CCD-NCD// coordinate system correspond to distinct subcellular migratory activities. A cluster of red dots shown are the CN correlation data acquired from 50 NIH 3T3 fibroblasts tracked at 1-min. time intervals for 1 hour. (c) The barcode enables visualization of the sequential occurrence of CN correlations in the four regions. Regions are distinguished by red, yellow, blue, and green, respectively. Each bar represents a CN correlation data point acquired at a 1-min time interval.

