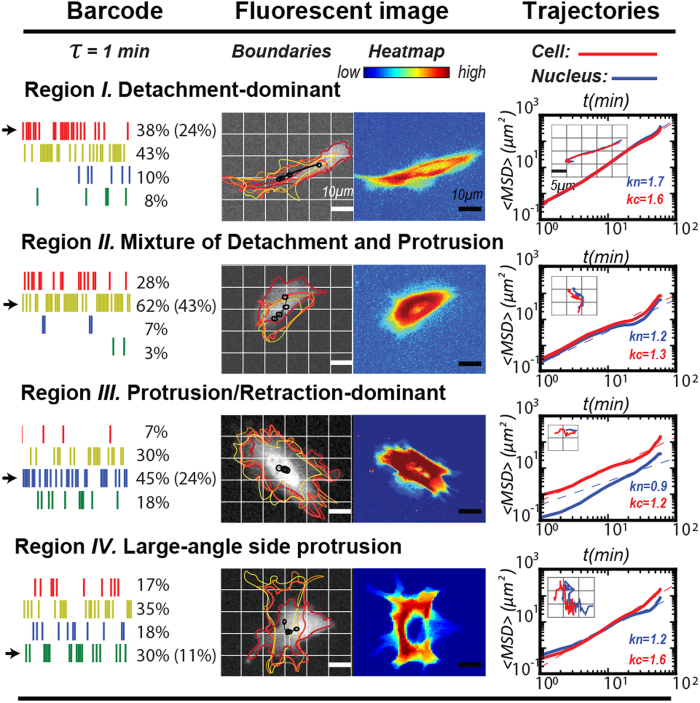
Figure 2. Specific barcodes identify significant locomotion events during the cell migration.
In each row, a barcode, fluorescent image, and the trajectories of the cell and its nucleus are depicted in the left, middle, and right panels, respectively. Left: Each barcode, which displays the analysis results from its cell migration movie, was obtained from 1-min time intervals and possesses a dominant CCD-NCD// relationship in one of the four regions of the CN correlation. The percentage of the individual bars in the barcode representing each region is showed in the right column. The averaged occurrence of a region overall (50 barcodes) is shown inside the parenthesis. Middle: On the left, the cell boundaries from the 1st, 21st, 41st, and 61st fluorescent cell images are overlaid. Black markers represent the nuclear centroid positions. Red arrows indicate the migration directions of individual cells. On the right, heat map marks the distributions of cell territories in all 61 frames of the movie. The hot-to-cold color gradient illustrates the density of cell area occupancies. Right: A logarithm-logarithm plot of the overlapping mean squared displacement of the cells (red) and nuclei (blue) vs. time lag. Inset: one-hour cell and coupled nucleus trajectories of NIH 3T3 fibroblasts, colored in red and blue, respectively.

