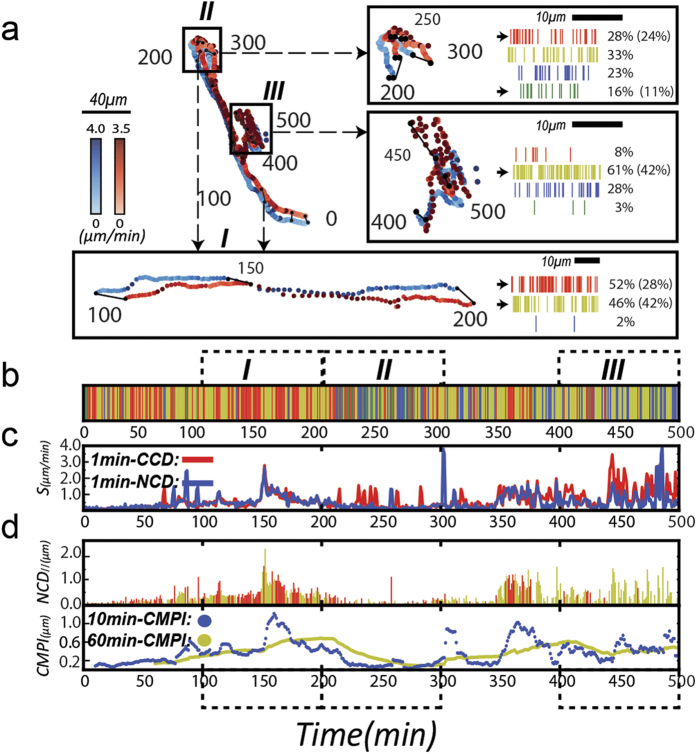
Figure 3. Long-term cell and nuclear trajectories and their correlations confirm the effectiveness of CN correlation approach in cell migration analysis.
(a) A 500-minute cell trajectory (red dots) and its coupled nuclear trajectory (blue dots) are displayed at one-min time intervals. Dots are displayed with color gradients to indicate the instantaneous speeds. Trajectories from 100th to 200th, 200th to 300th, and 400th to 500th minutes are separately re-drawn with the corresponding barcodes. Black lines illustrate the temporal relationship between the two trajectories by connecting the cell and the corresponding nuclear positions in 50-minute time points. (b) Trajectories of cells are presented as a region-mixed barcode. Bars are aligned by their time sequences and each bar indicates a predominant subcellular migratory activity: detachment-dominant (red), mixed detachment and protrusion (yellow), protrusion-dominant (blue) and large-angle side protrusion (green). (c) Instant nucleus (blue) and cell (red) migratory speeds are shown, calculated by one-min time sequences. (d) Upper Row: CN correlations that occurred in Region I (red) or II (yellow) are depicted, where the value of NCD// is plotted against time sequences. Bottom Row: Moving averages of CMPI are plotted against the time at 10-min (blue) and one-hour (yellow) intervals.

