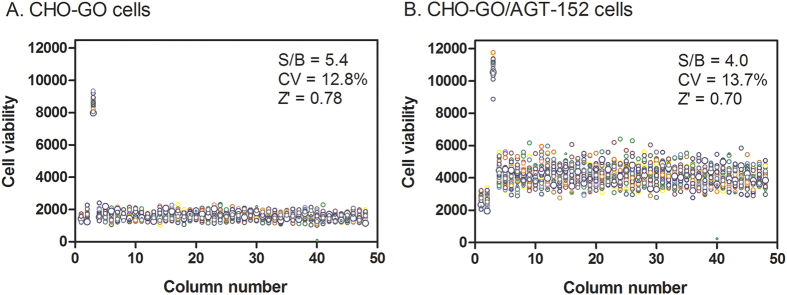
Figure 3. Scatter plots of DMSO screening plates.
The signal-to-basal ratio (S/B), coefficient of variation (CV), and Z’ factor were calculated and displayed. The wells in column 3 contained untransformed CHO WT cells while the wells in column 1 and 2 contained CHO-GO cells. GO DMSO assay plate contained CHO-GO cells in columns 4–48 (A), and GO/AGT-152 DMSO assay plate contained CHO-GO/AGT-152 cells in columns 4–48 (B). All wells were added with 23 nl DMSO for 1 h followed by glycolate addition (final glycolate concentration of 0.5 mM and DMSO concentration of 0.57%).

