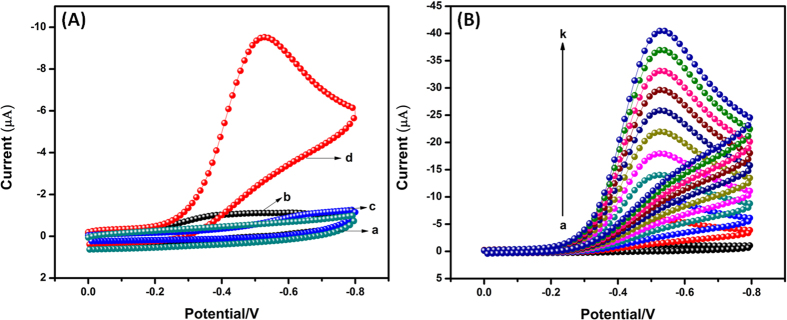
Figure 8.
(A) Cyclic voltammograms for the reduction of H2O2 on bare GCE (a,c) and Ag2MoO4 modified GCE (b,d) in absence (a,b) and presence (c,d) of 200 μM H2O2 containing N2 saturated 0.05 M PBS (pH 7) at a scan rate of 50 mV/s. (B) Cyclic voltammograms of Ag2MoO4 modified GCE in N2 saturated 0.05 M PBS (pH 7) in the absence and presence of H2O2 with different concentrations (a–k: 0 to 1 mM) at a scan rate of 50 mV/s.

