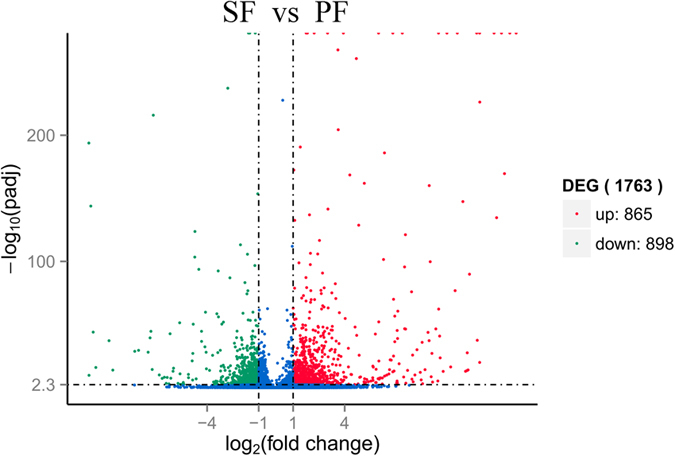
Figure 5. Volcano plot of differentially expressed genes in SF and PF.

Differentially expressed genes were selected by q-value < 0.005&|log2 (fold change)|> 1 according the method of Storey et al.18. The x-axis shows the fold change in gene expression between SF and PF, and the y-axis shows the statistical significance of the differences. Splashes represent different genes. Blue splashes means genes without significant different expression. Red splashes means significantly up expressed genes. Green splashes means significantly down expressed genes. SF: sexual female, PF: parthenogenetic female, −log10(padj): the corrected p-value.
