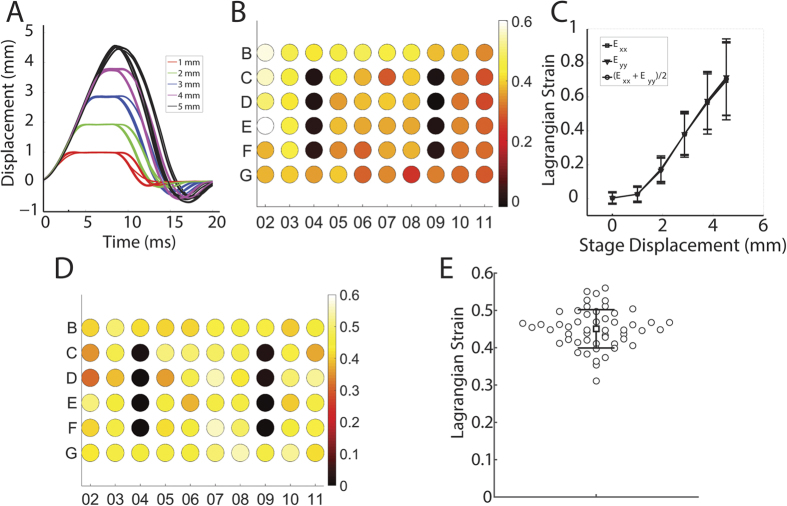
Figure 1. Kinematics of the injury device.
(A) Stage displacement histories over 10 pulses at a range of target amplitudes. (B) Average strain in each well in misaligned configuration with displacement of 2.9 mm (n = 5 measurements per well, average standard error per well = 0.056). Note that C4, D4, E4, F4, C9, D9, E9 and F9 are uninjured control wells. (C) The Lagrangian strain in the membrane increased with increasing stage displacement (n = 200–260 wells over 10 plates, bars = standard deviation). (D) Average strain in each well in optimally aligned configuration with displacement of 3.3 mm (n = 5 measurements per well, average standard error per well = 0.029). (E) Distribution of strains in optimally aligned configuration (circle = average strain in a single well location, square = average strain across all well locations, error bars = 1 standard deviation).

