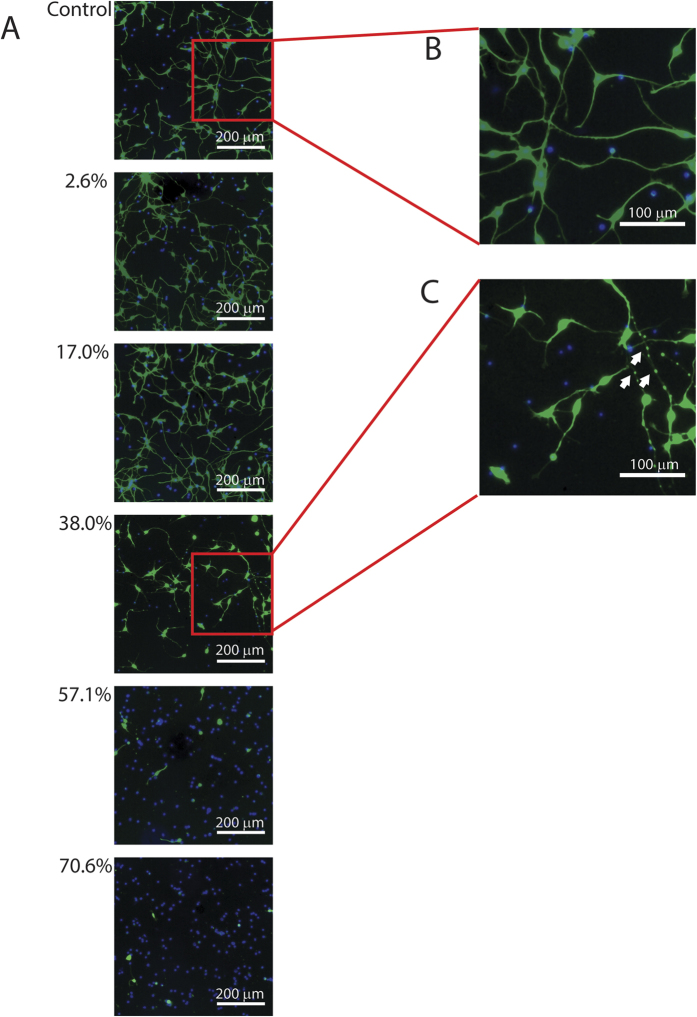
Figure 3. Evolution of injury phenotype with increasing strain.
(A) Representative images of neurons stained with calcein AM (green) and Hoechst 333342 (blue) 4 hours after injury at various levels of strain. As strain increases, the neurite network becomes less extensive and the number of calcein-AM negative nuclei increases, indicating cell death. (B) In the control condition, neurites have a large, constant thickness. (C) In injured neurons, neurites are shorter and thinner with beads (see white arrows) distributed along their length.

