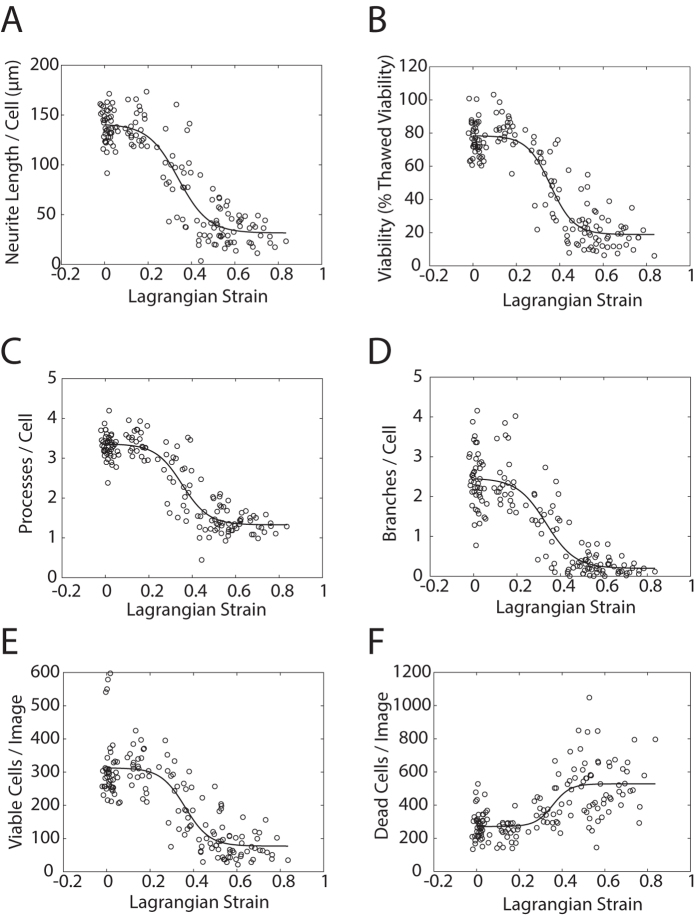
Figure 4. Injury phenotypes increase with increasing strain.
(A) Mean neurite length per cell declines with increasing strain. (B) Cell viability declines with increasing strain. (C) Processes/cell declines with increasing strain. (D) Branches/cell declines with increasing strain. (E) Viable cells/image declines with increasing strain. (F) Dead cells/image increases with increasing strain. Injury metrics are plotting against well-specific strain. For phenotype measurements, n = 160 wells over 5 plates. For strain measurements, n = 800 wells over 50 plates (i.e. each point represents the average of 5 measurements (average standard error = 0.056). In both cases, the fit line represents a generalized logistic regression of the data (see Methods). Estimates for the coefficients of each fit along with confidence intervals and R2 values are presented in Table 2.

