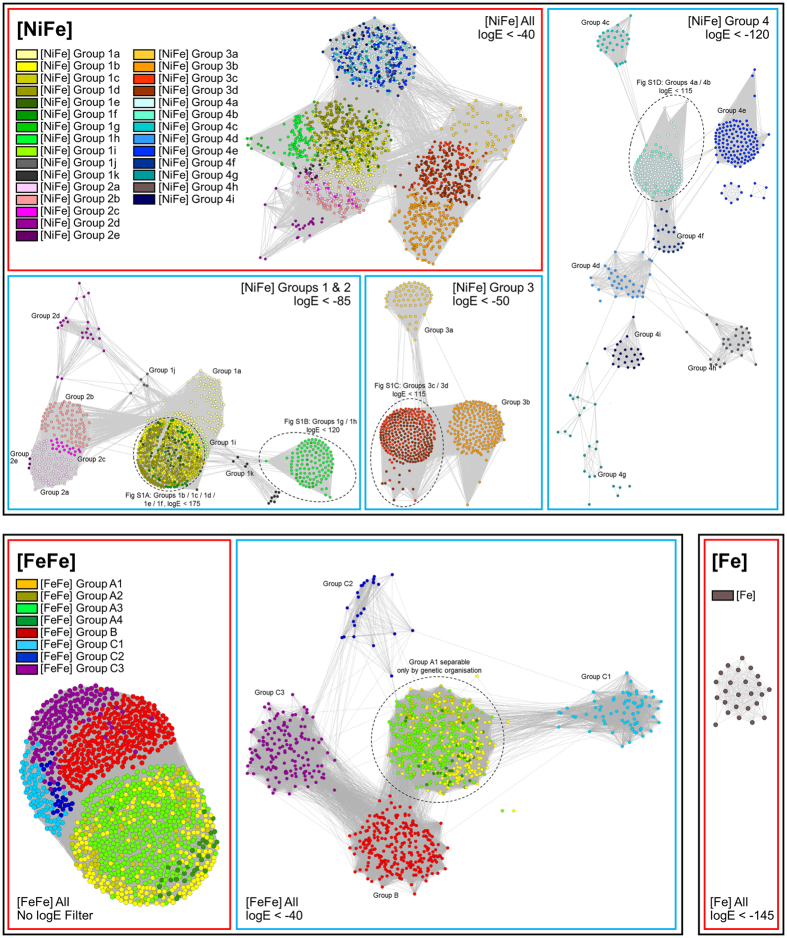
Figure 1. Sequence similarity network of hydrogenase sequences.
Nodes represent individual proteins and the edges show the BLAST E-values between them at the logE filter defined at the bottom-left of each panel. The sequences are colored by class as defined in the legends. Figure S1 shows the further delineation of the encircled [NiFe] hydrogenase classes.

