
Figure 1.
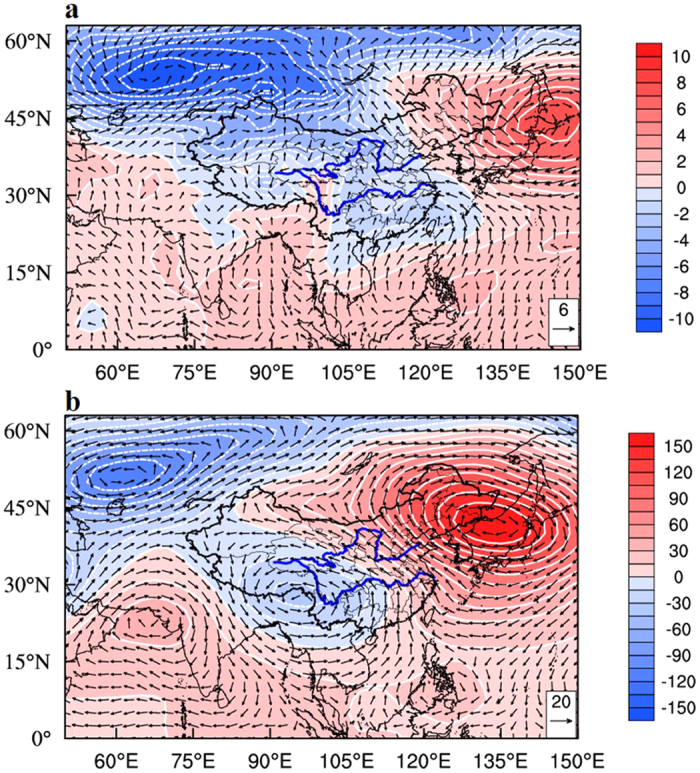
(a) Anomalies of monthly mean general circulation between Dec. 2015 and Dec. 2014 in eastern Asia. The shaded and the white lines represent the sea level pressure (hPa) and the vectors for the 10-meter wind field (m s−1). NCEP/NCAR re-analysis data were applied in the study. (b) Same as (a), except at 500 hPa. The Data/image provided by the NOAA/OAR/ESRL PSD, Boulder, Colorado, USA, from their Web site at http://www.esrl.noaa.gov/psd. The map was generated by The NCAR Command Language (Version 6.3.0) [Software]. (2016). Boulder, Colorado: UCAR/NCAR/CISL/TDD. http://dx.doi.org/10.5065/D6WD3XH5.