
Figure 3. Monthly mean anomalies between Dec. 2015 and Dec. 2014 of surface wind speed (m s−1) in eastern China.
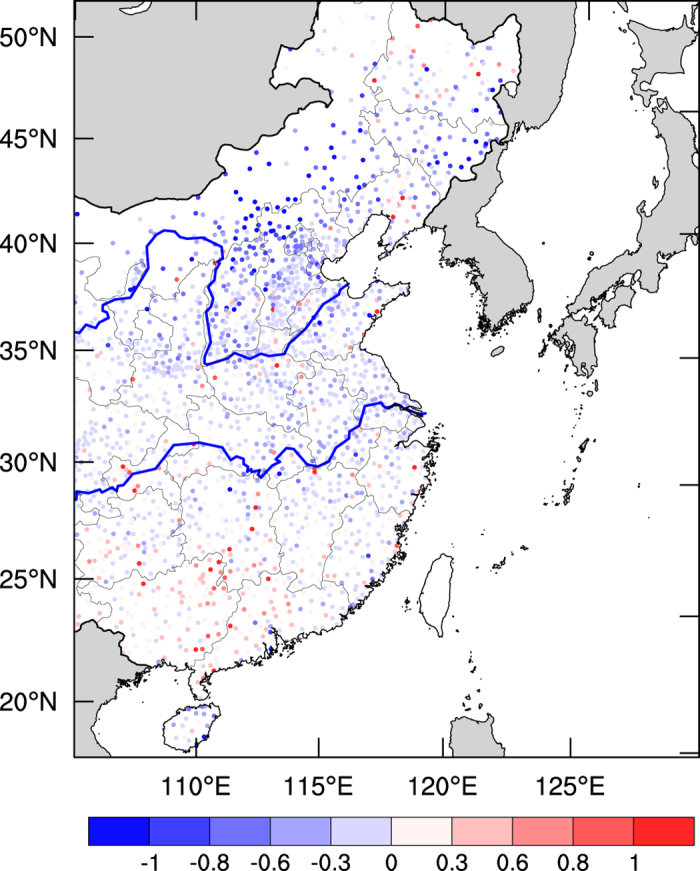
Rainy days were excluded. The wind speeds were measured by the National Climate Center of China at 2,540 monitoring sites. The map was generated by The NCAR Command Language (Version 6.3.0) [Software]. (2016). Boulder, Colorado: UCAR/NCAR/CISL/TDD. http://dx.doi.org/10.5065/D6WD3XH5.