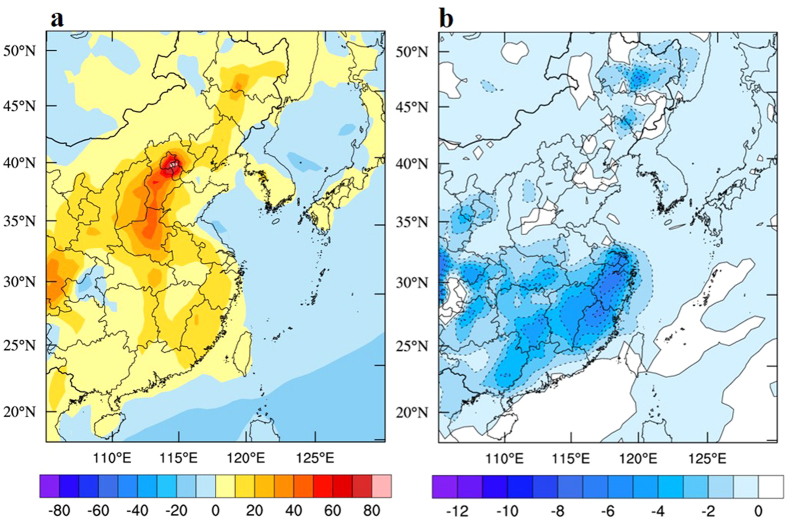
Figure 5.
(a) The calculated changes in PM2.5 concentrations (μg m−3) in eastern China without wet deposition of aerosol particles. (b) The calculated change in PM2.5 concentrations (μg m−3) due solely to wet deposition of aerosol particles, the dash line denotes negative change in in PM2.5 concentrations. The map was generated by The NCAR Command Language (Version 6.3.0) [Software]. (2016). Boulder, Colorado: UCAR/NCAR/CISL/TDD. http://dx.doi.org/10.5065/D6WD3XH5.

