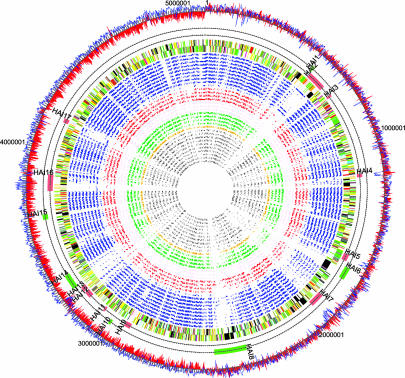
Fig. 1.
Comparison of the Eca genome sequence with other bacterial genomes. Inner to outer tracks show the locations of RBHs found by reciprocal fasta of Eca CDSs against those from 32 bacterial genomes (circular plot): Gram-positive (gray); Shewanella oneidensis (ochre); nonenteric animal pathogens (green); plant-associated bacteria (brown); nonenteric plant pathogens (red); and enterobacteria (blue) (Table 2). The locations of CDSs on the Eca genome colored by functional class (see legend to Fig. 5). Two tracks indicating HAIs listed in Table 1. Shown are islands with evidence of recent acquisition (red bars) and possible islands based on reciprocal FASTA analysis (green bars). A plot of G+C skew (red) and percent G+C content (blue).

