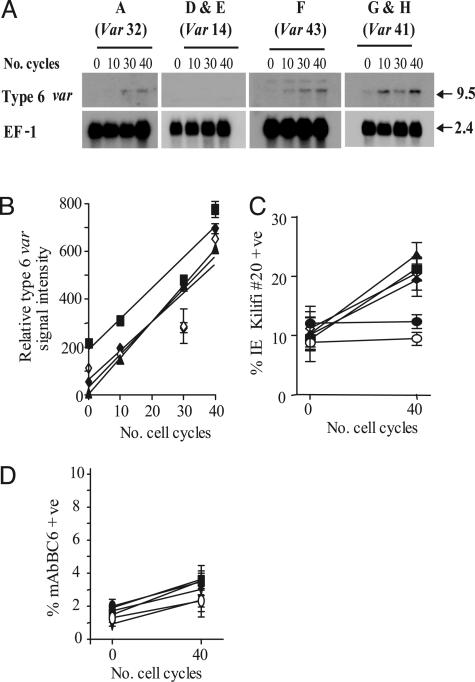
Fig. 2.
Var transcript on-rates (ron) are fixed in P. falciparum.(A) Steady-state transcript levels of type 6 var in clones A and D–H over 40 cycles of intraerythrocytic growth. The predominant var type transcribed in each of these parasite clones is indicated above their respective panels. Clones B and C are not shown because var type 6 is the predominant transcript in these clones. The size of each transcript is described in kb. The hybridization signal from the control transcript EF-1α is indicated as used for one of several loading and staging controls. (B) Analysis of the relative increase in type 6 var transcript in clones A and F–H over 40 cycles of cell growth. Logarithmic regression of the mean relative signal intensity (±SEM, n = 3) indicates that type 6 var accumulates at the same rate (ron = 0.25% per generation) in all of these clones. Data points for each clone are represented as follows; clone A (▴), clone F (▪), and clones G and H (♦ and ⋄). (C) Flow cytometry analysis of type 6 var-encoded PfEMP1 molecule expression. The proportion of infected erythrocytes (mean ± SEM, n = 3) recognized by var type 6-specific serum (kilifi#20) over 40 cycles of growth is indicated. Whereas the proportion of infected erythrocytes in clones A and F–H recognized by kilifi#20 increases at a mean ron of 0.25% per generation, there is no appreciable increase in kilifi#20 binding to clones D and E (• and ○) over the same period. (D) Flow cytometry analysis of type 41 var-encoded PfEMP1 molecule expression in clones A–F. The proportion of infected erythrocytes (mean ± SEM, n = 3) recognized by mAbBC6 over 40 cycles of growth is indicated. In these six clones, not originally transcribing the type 41 var gene variant, the proportion of parasites recognized by mAbBC6 increases at a mean ron of 0.025% per generation. Symbols used are the same as for above.

