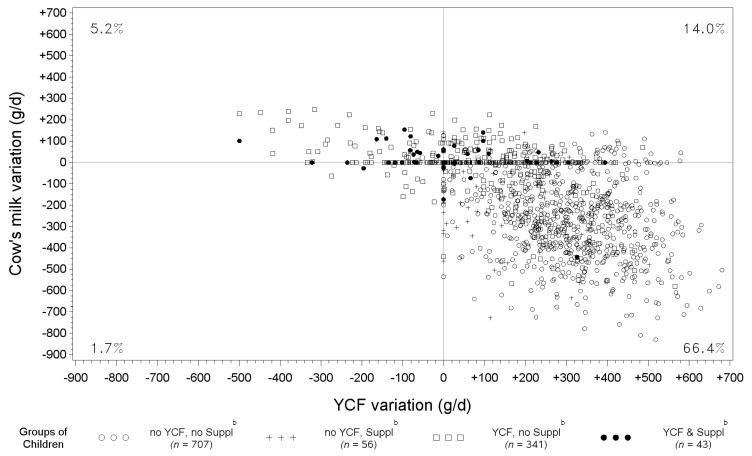
Figure 3.
Scatter plot of the variations in YCF and cow’s milk quantities between diets modeled with all-foods models a and observed diets and percentage of children in each quarter *, according to the groups of children. a “All-foods models” refers to the linear programming models where all of the foods reported as consumed by the sample were taken as variables. b “No YCF, no Suppl” refers to children who did not consume either YCFs or supplements during the four days of dietary record; “no YCF, Suppl” refers to those who did not consume YCFs, but who consumed supplements; “YCF, no Suppl” refers to those who consumed YCFs, but not supplements; “YCF & Suppl” refers to those who consumed both YCFs and supplements. * Values in each quarter indicate the percentage of children in this quarter, excluding those with null variations. Null variations for both cow’s milk and YCFs (spots at the center of the grid) were seen for only 0.4% of the whole sample; 2.5% had a variation in cow’s milk, but not in YCF (spots on the vertical line, x = 0); and 9.6 % had a variation in YCF, but not in cow’s milk (spots on the horizontal line, y = 0).

