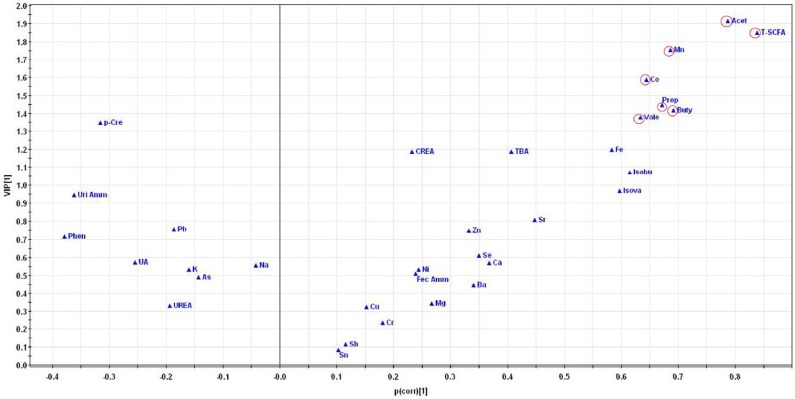
Figure 5.
V plot of the partial least squares-discriminant analysis of overall indexes including the metabolites and elements in the three groups. Each triangle denotes an individual component. The triangles far away from the origin represent the components responsible for the differences among the three groups. The acetic acid, total SCFA, Mn, Co, propionic acid, butyric acid and valeric acid are the farthest away from the origin in the V plot, which further indicates that they are the differential components obtained from the PLS-DA model. Acet, acetic acid; Prop, propionic acid; Buty, butyric acid; Isobu, isobutyric acid; Vale, valeric acid; Isova, isovaleric acid; T-SCFA, total SCFA; TBA, total bile acids; Phen, phenol; p-Cre, p-cresol; UA, uric acid; CREA, creatinine; Fec Amm, fecal ammonia; Uri Amm, urinary ammonia.

