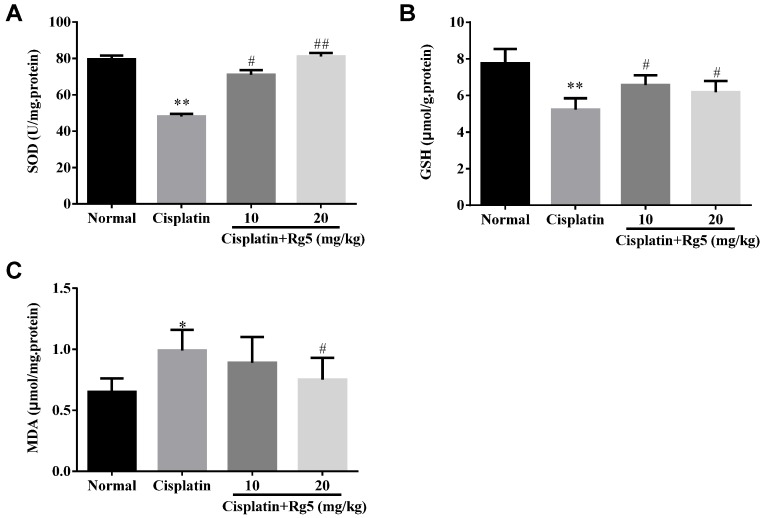
Figure 3.
Effects of Rg5 on the levels of: SOD (A); GSH (B); and MDA (C) in cisplatin-induced nephrotoxicity. All data were expressed as mean ± S.D., n = 8. * p < 0.05, ** p < 0.01 vs. normal group; # p < 0.05, ## p < 0.01 vs. cisplatin group. GSH = glutathione; SOD = superoxide dismutase; MDA = malondialdehyde.

