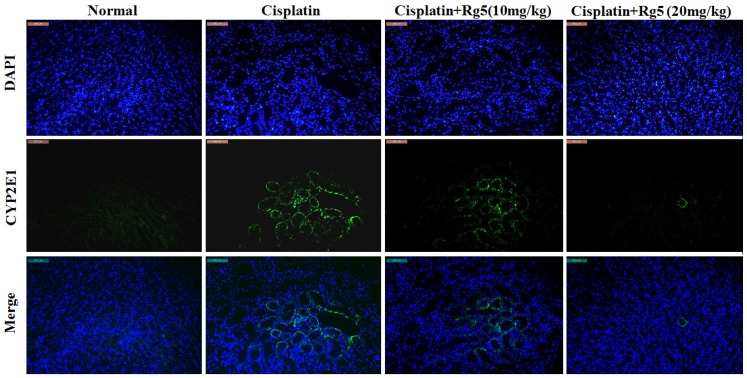
Figure 4.
Effects of ginsenoside Rg5 on the expression of cytochrome P450 E1 (CYP2E1). The expression level of CYP2E1 (green) in tissue section isolated from different groups was assessed by immunofluorescence. Representative immunofluorescence images were taken at 400×. 4′,6-Diamidino-2-phenylindole (DAPI) (blue) was used as a nuclear counterstain.

