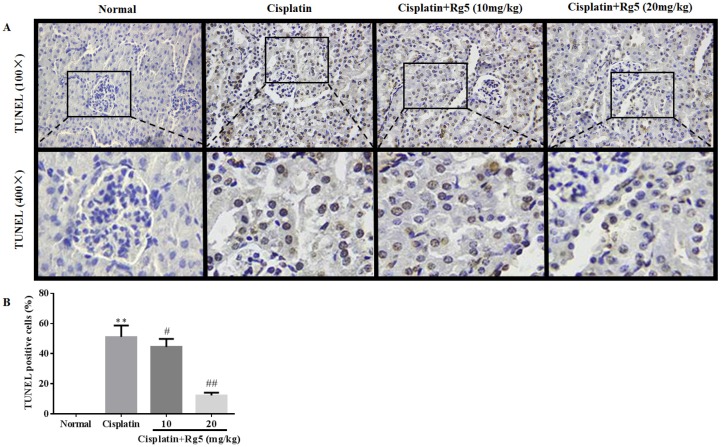
Figure 8.
Histological examination of morphological changes in kidney tissues. Renal tissues stained with TUNEL (100× & 400×) (A). The presence of TUNEL positive cells were measured by the image analyzer (B). All data were expressed as mean ± S.D., n = 8. ** p < 0.01 vs. normal group; # p < 0.05, ## p < 0.01 vs. cisplatin group.

