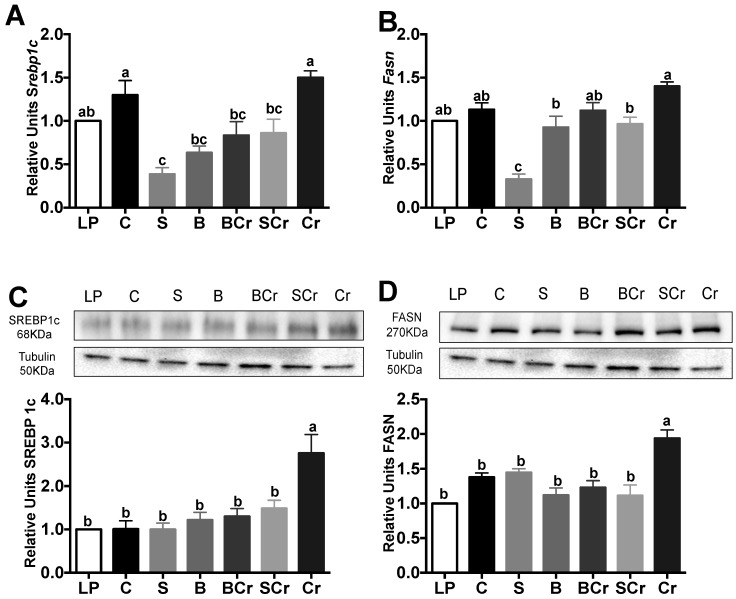
Figure 8.
mRNA gene expression and Western blot analysis of SREBP1C and FASN in rats fed different types of proteins after a protein restricted period: (A) Srebp1c mRNA abundance; (B) Fasn mRNA abundance; (C) abundance of SREBP1c; and (D) abundance of FASN. Values are means ± SEM, n = 3. Different letter superscript indicates significant differences among groups, p < 0.05, a > b > c.

