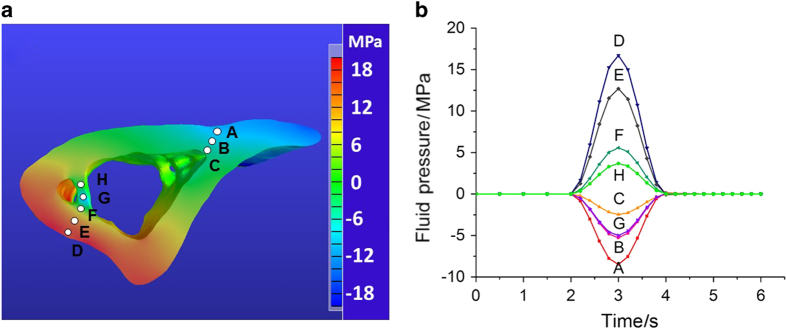
Figure 6.
FEBio simulation of fluid pore pressure in the segment model. (a) The pore fluid pressure field at t=3 s at the cross-section containing the FRAP site (location A). (b) The temporal fluid pressure changes at the cortical (A–F) and trabecular sites (G, H) during one loading cycle (Figure 1b).

