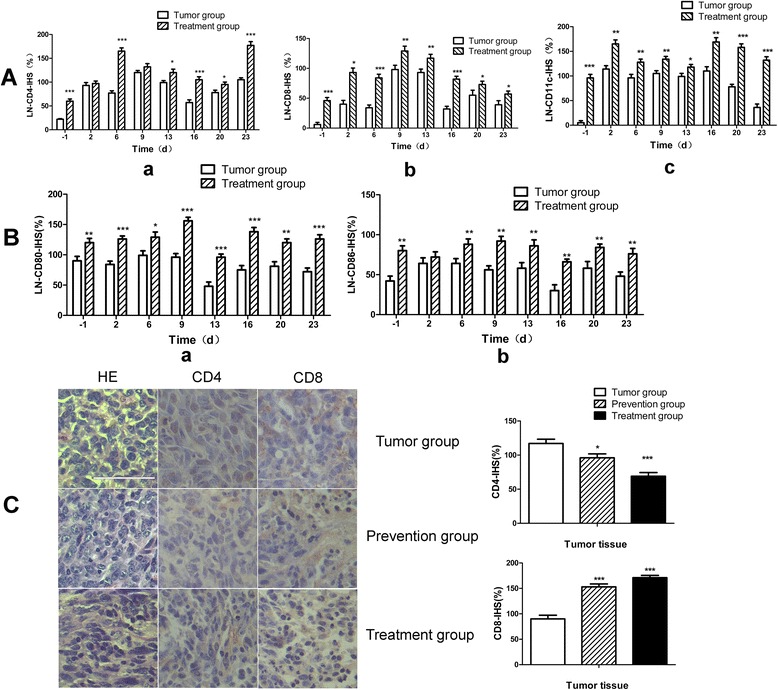
Fig. 5.

Distribution of CD4+, CD8+, CD11c+, CD80+ and CD86+ cell populations in Lymph node and tumor tissue Panel A, represents the expression of CD4 (a), CD8 (b) and CD11c (c) as analyzed by IHC staining of LN isolated at different time points from tumor control or treatment group mice. Panel B, represents the expression of CD80 (a) and CD86 (b) as analyzed by IHC staining of LN isolated at different time points from tumor control or treatment group mice. The expression of these molecules was calculated by IHS. Panel C, represents the HE and anti-CD4 and -CD8 IHC staining of tumor tissues collected from different groups. The results were observed in (40 × 10) horizon. Data are represented as mean ± SD. Bar = 50 μm. *denotes p < 0.05, **denotes p < 0.01, ***denotes p < 0.001
