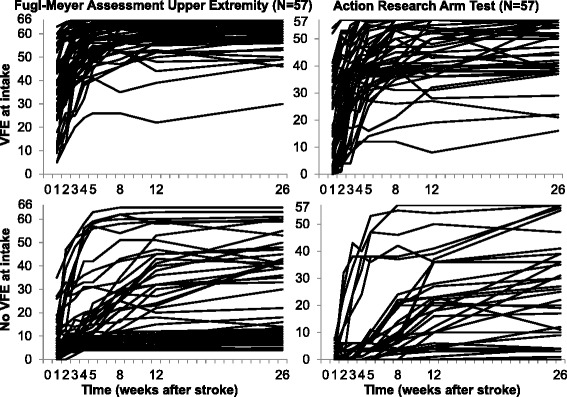
Fig. 1.

Individual FMA-UE and ARAT recovery curves for patients with and without Voluntary Finger Extension (VFE). The top two graphs represent the patients with VFE at about 1 week after stroke and the bottom two graphs the patients without VFE. The lefthand two graphs and righthand two graphs represent, respectively, the Upper Extremity motor scores of the Fugl-Meyer Assessment (FMA-UE, score = 0–66, 66 = normal function) and the Action Research Arm Test (ARAT, score = 0–57, 57 = normal capacity)
