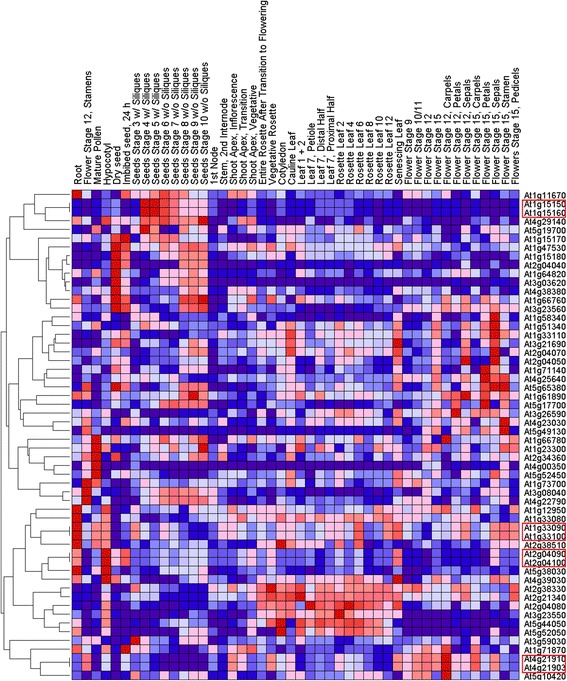
Fig. 4.

Expression profiles of Arabidopsis thaliana MATE genes. The level of expression is shown by the color and its intensity: deep red indicates the highest level of expression, deep blue the lowest. Other hues indicate intermediate levels of expression. The proteins highlighted by the red outlined boxes represent small phylogenetic clades that have similar transcript abundance profiles
