
Fig. 4.
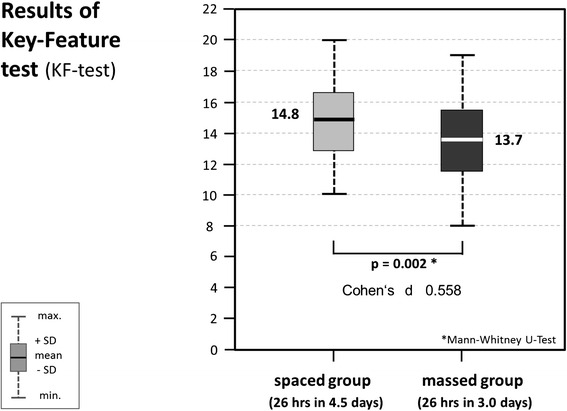
KF-test scores of “spaced” student group (light grey) vs. “massed” student group (dark grey); significant difference: p = .002 (Mann–Whitney-U); Cohen’s d: 0.558
Official websites use .gov
A
.gov website belongs to an official
government organization in the United States.
Secure .gov websites use HTTPS
A lock (
) or https:// means you've safely
connected to the .gov website. Share sensitive
information only on official, secure websites.
KF-test scores of “spaced” student group (light grey) vs. “massed” student group (dark grey); significant difference: p = .002 (Mann–Whitney-U); Cohen’s d: 0.558