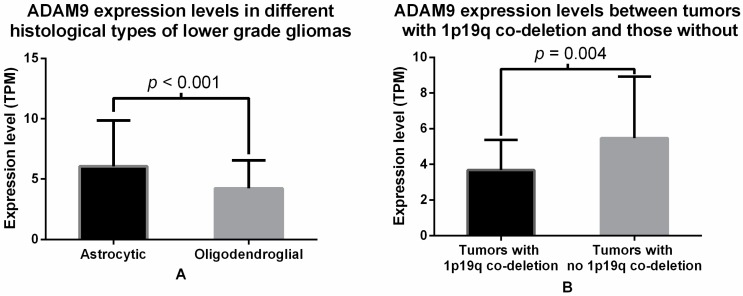
Figure 2.
(A) Comparison of ADAM9 mRNA expression levels between LGG tumor samples with different histological type. Black bar represents the average ADAM9 mRNA expression from astrocytic tumors (6.051 ± 0.460 TPM units), while white bar represents ADAM9 mRNA expression in oligodendroglial tumors (4.228 ± 0.231, TPM units). The difference is significant with a p-value of <0.001, t-test; (B) Comparison of ADAM9 mRNA expression levels between LGG tumor samples with and without 1p/19q co-deletion. Black bar represents the average ADAM9 mRNA expression in tumors with 1p/19q co-deletion (3.386 ± 0.289 TPM units), while white bar represents ADAM9 mRNA expression in tumors with no 1p/19q co-deletion (5.476 ± 0.332, TPM units). The difference is significant with p-value of 0.004, t-test.

