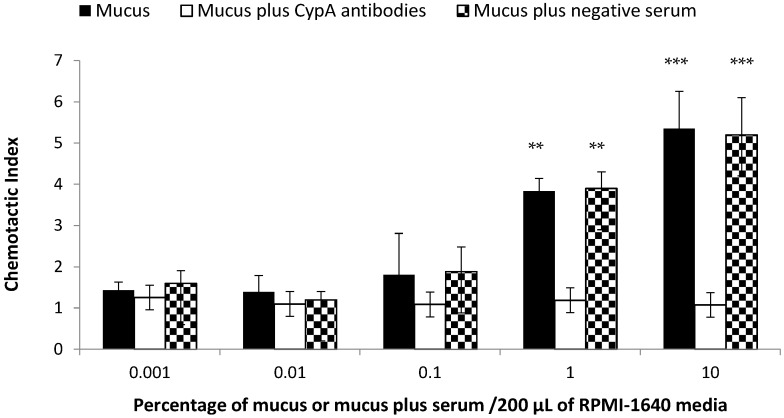
Figure 2.
Comparative chemotactic activity of various concentrations of yellow catfish skin mucus. The black bar shows the chemotactic activity of various concentrations of yellow catfish skin mucus for head kidney leucocytes of yellow catfish. The white bar shows the chemotactic activity of the skin mucus when the CypA was blocked by CypA-specific antibodies. The doted bar indicates the chemotactic activity of skin mucus plus serum (negative control). The chemotactic activity is shown as the chemotactic index. Data are expressed as the means ± SD, (n = 3) of three fish. Bars with “**” are highly significantly different (p < 0.01), while bars with “***” are very highly significantly different (p < 0.001).

