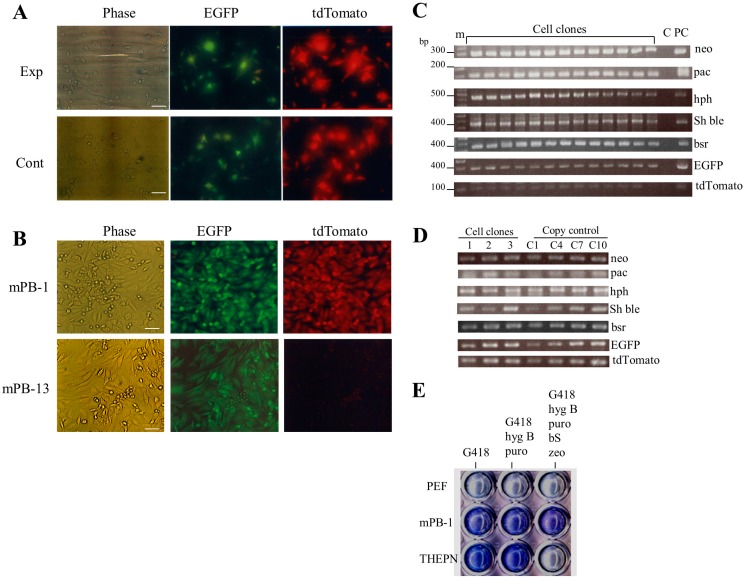
Figure 2.
Acquisition of stable PEF transfectants after simultaneous transfection with seven PB vectors. (A) Fluorescence micrographs of PEFs one day after transfection in the presence (experimental group, Exp) or absence (control group, Cont) of pTrans. Note that in both transfection groups there are some cells exhibiting both green and red fluorescence, but no significant difference in gene transfer efficiency between these two groups was observed. Phase, taken under light; tdTomato, red fluorescence derived from tdTomato in pT-tdTomato; and EGFP, green fluorescence derived from EGFP in pT-EGFP. Scale bars = 20 µm; (B) fluorescence micrographs of stable PEF transfectants (mPB-1 and mPB-13). Note that mPB-1 exhibited both green and red fluorescence, whereas only green fluorescence was observed for mPB-13. The abbreviations above each figure are the same as shown in (A). Scale bars = 20 µm; (C) PCR analysis of stable PEF transfectants (numbered mPB-1 to 13). Genomic DNA isolated from each transfectant was subjected to regular PCR using the primer sets shown in the Materials and Methods. m, 100-bp ladder markers; lane C, normal PEFs; lane PC, control plasmids (pT-neo for detection of neo, pT-pac for detection of pac, pT-hph for detection of hph, pT-Sh ble for detection of Sh ble, pT-bsr for detection of bsr, pT-EGFP for detection of EGFP cDNA, and pT-tdTomato for detection of tdTomato cDNA); (D) determination of the number of copies of the introduced transposon DNA in the PEF transfectants (mPB-1 (lane 1), -2 (lane 2), and -3 (lane 3)). C1, C4, C7, and C10 indicate PEF DNA plus one, four, seven, or 10 copies of transposon DNA, respectively; (E) Assay of drug sensitivity in stable PEF transfectants. Cells (mPB-1, THEPN, and untransfected PEFs (PEF)) were plated in a 48-well plate, and cultured in medium containing G418, medium containing G418 + hygromycin B (hyg B) + puromycin (puro), or medium containing G418 + hyg B + puro + blasticidin S (bS) + zeocin (zeo), for 10 days. After culturing, cells were stained with Giemsa stain for visualization.

