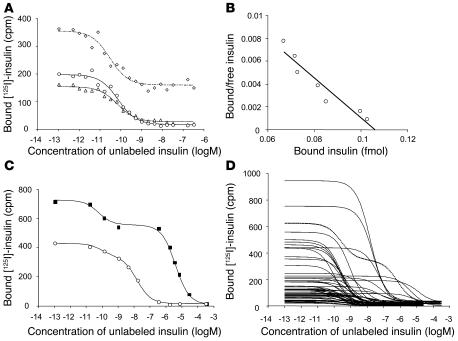
Figure 1.
Competitive insulin binding curves of IAAs. (A) Competition of an IAA-positive serum against [125I] insulin labeled at Tyr14A (circles), Tyr19A (triangles), and Tyr16B (diamonds) with increasing concentrations of unlabeled human insulin. Binding curves were similar with the [125I] insulin labeled at residues Tyr14A, Tyr19A, or Tyr16B, and calculated IAA affinities did not significantly differ among Tyr14A [125I] insulin (2.1 × 10¹¹ l/mol), Tyr19A [125I] insulin (2.3 × 10¹¹ l/mol), and Tyr16B [125I] insulin (5.7 × 10¹¹ l/mol). Insulin labeled at position Tyr16B was associated with considerably higher nonspecific binding than insulin labeled at Tyr14A or Tyr19A. (B) Scatchard analysis performed for the competition curve obtained against Tyr14A radiolabeled insulin. (C) Binding curves of a serum mix containing a serum with high-affinity IAAs (1.7 × 10¹¹ l/mol) and a serum with low-affinity IAAs (2 × 10⁵ l/mol) (squares) and a serum mix containing a serum with high-affinity IAAs (1.7 × 10¹¹ l/mol) and a serum with moderate-affinity IAAs (6.3 × 10⁷ l/mol) (circles). Both curves fit a 2-site binding model. (D) Binding curves obtained for the first IAA-positive serum from 56 children in the BABYDIAB study. IAA binding in 1 serum conforms to a 2-site binding model (dotted line), whereas the remaining sera conform to a 1-site binding model. Curves that are shifted to the right indicate lower-affinity IAAs.

