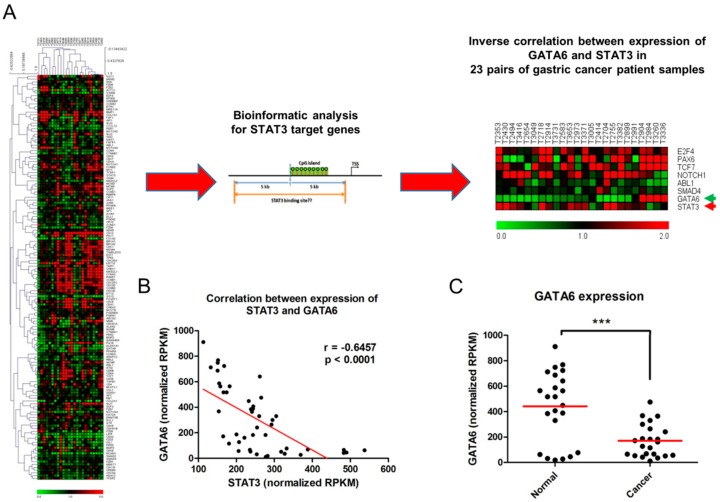
Figure 1.
Inverse correlation between the expression of signal transducer and activator of transcription 3 (STAT3) and GATA6 in gastric cancer: (A) Heatmap showing the expression profile for 23 pairs of gastric cancer patients investigated in the RNA-Seq experiment (Please refer to Figure S1 for a higher resolution version of the heatmap). Bioinformatic analysis was used to identify potential STAT3 targets by filtering genes with at least one STAT3 binding site within 5 kb of the promoter CpG island. Integration of RNA-Seq and bioinformatic analyses identified several genes, including GATA6, which were correlated with the expression of STAT3; (B) Scatter plot illustrates the inverse correlation between the expression of STAT3 and GATA6 among 23 pairs of gastric cancer patients; (C) Dot plot shows a significantly higher expression of GATA6 in adjacent normal tissues than that of cancer tissues (*** p < 0.001). Red bar indicates median. TSS: transcription start site; RPKM: reads per kilobase per million.

