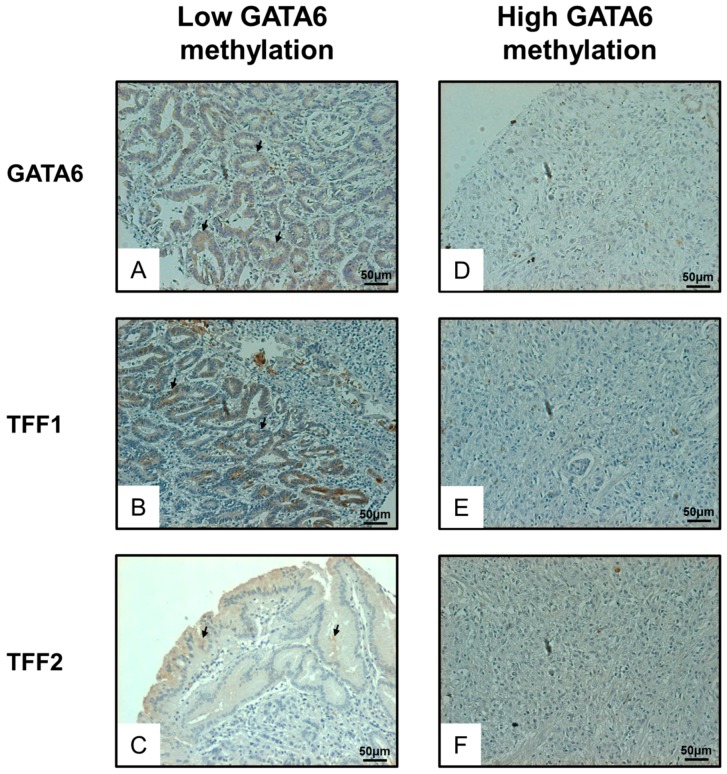
Figure 5.
Immunohistochemistry examination of GATA6, TFF1 and TFF2 in gastric cancer patient samples: Samples with low GATA6 methylation (left panel) have higher expression of GATA6 (A) as well as TFF1 (B) and TFF2 (C) as indicated by brown color (arrow). In contrast, samples with high GATA6 methylation (right panel) have lower expression of GATA6 (D), TFF1 (E), and TFF2 (F). Magnification, 100×.

