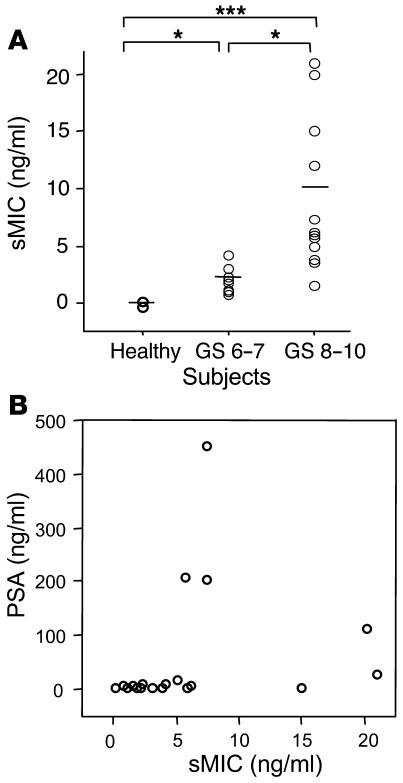
Figure 3.
Serum levels of sMIC and PSA. (A) Serum levels of sMIC in healthy subjects (Healthy; n = 10) and prostate cancer patients with primary carcinomas with a GS of 6–7 (n = 13) or a GS of 8–10 (n = 10). Horizontal lines indicate mean value of respective groups. *P < 0.05; ***P < 0.001. Data shown are mean values of three independent ELISA measurements. (B) Lack of correlation of serum levels of sMIC with PSA in prostate cancer patients (r = 0.02, P = 0.48).

