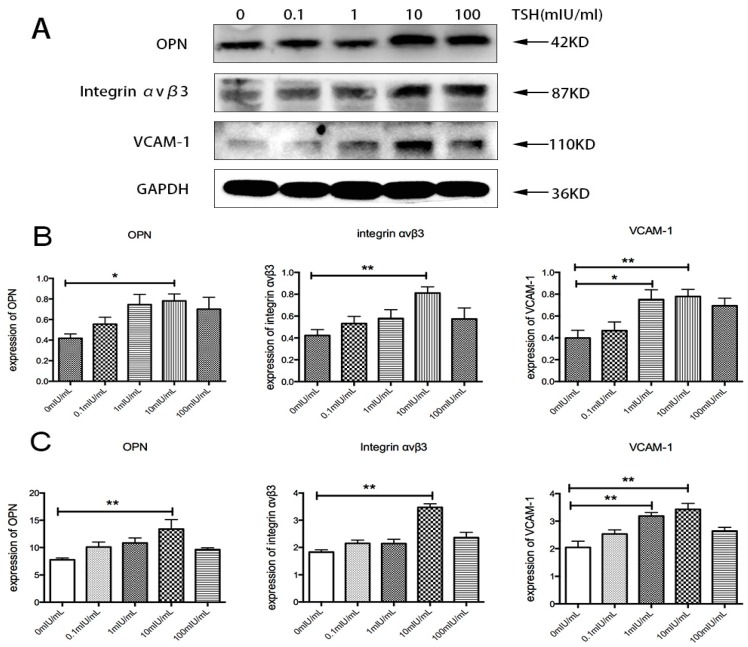
Figure 4.
Effects of concentrations of TSH (0, 0.1, 1, 10, 100 mIU/mL) in HUVECs over 24 h. (A) The bands depict representative findings of OPN, integrin αvβ3, and VCAM-1 protein expression levels in HUVECs stimulated by different concentration of TSH; (B) The bar graphs showed the results of the semiquantitative measurements of OPN, integrin αvβ3, and VCAM-1, respectively; (C) The bar graphs showed the results of the quantitative analysis of OPN, integrin αvβ3, and VCAM-1 from real-time PCR. The OPN, integrin αvβ3, and VCAM-1 mRNA levels were expressed as ratios relative to GAPDH. The results are shown as the means ± SEM of three independent experiments. * p < 0.05 versus control; ** p < 0.01 versus control.

