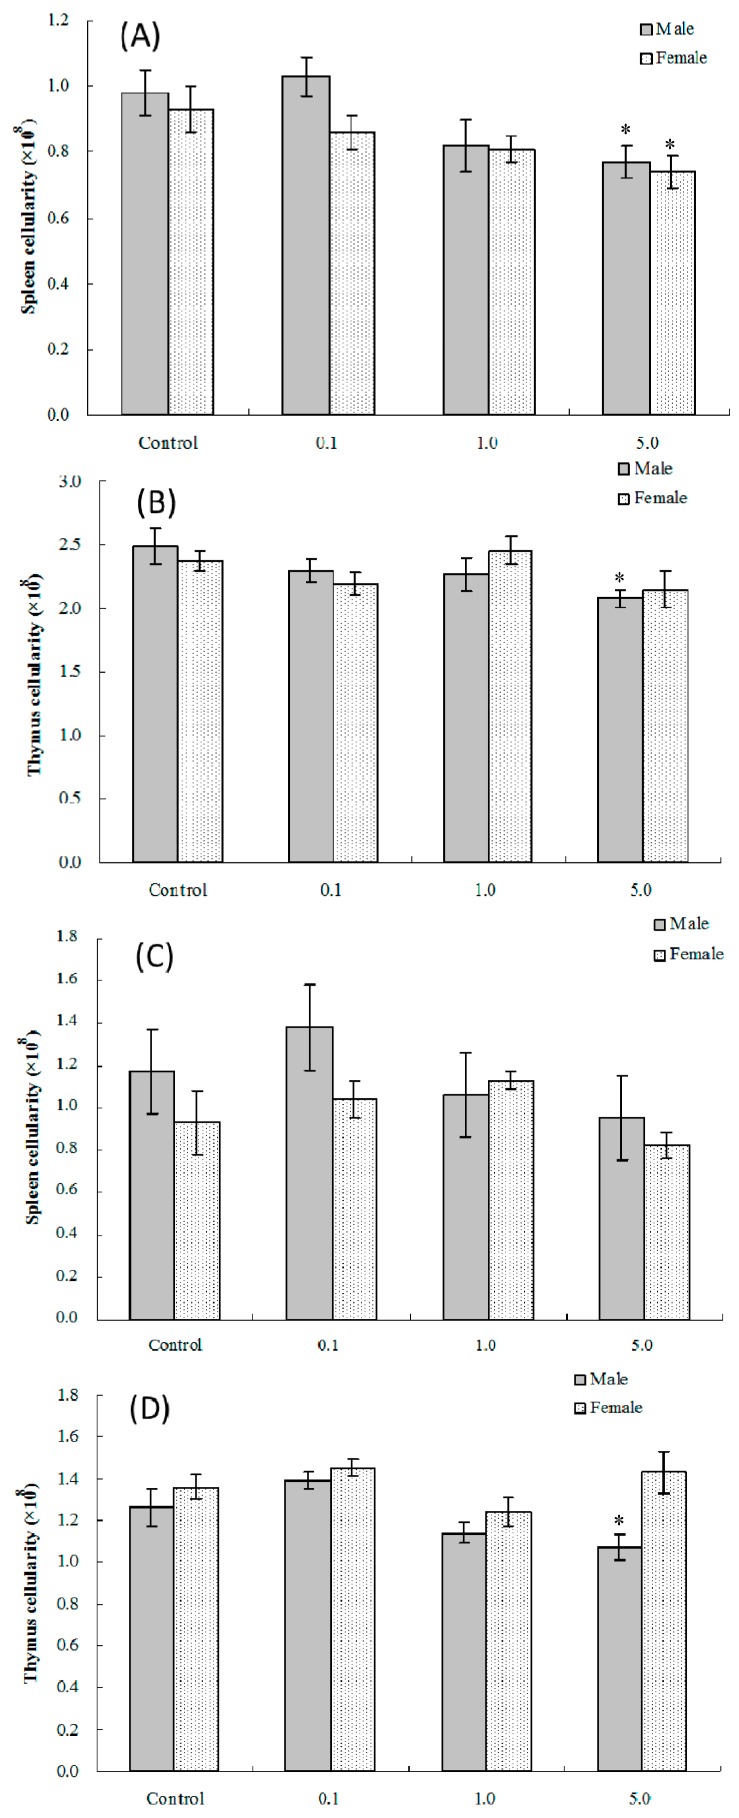
Figure 1.
Splenic and thymic cellularity in C57BL/6 pups exposed in utero to PFOS during GD 1–17. Mice at (A,B) four and (C,D) eight weeks of age. Data shown are the mean ± SEM. * Value significantly different from respective controls (p ≤ 0.05) by the one-way ANOVA test. All data were log-transformed as required for statistical analysis. n = 12 each group.

