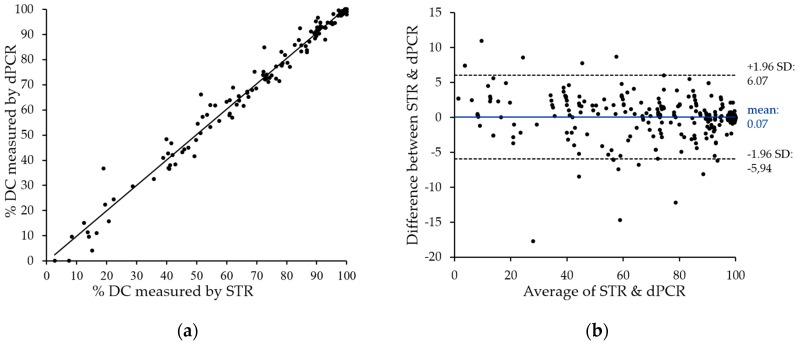
Figure 4.
Excellent correlation of chimerism data as obtained on clinical samples by dPCR vs. STR Chimerism was assessed for 147 post-SCT samples by both dPCR and STR analyses. (a) Obtained data were analyzed for linear regression of percent donor chimerism (DC) (digital PCR assays are regularly designed to quantify remaining patient cells). As shown, a very high degree of correlation (r2 > 0.98) was observed; (b) Bland–Altmann analysis of dPCR as compared to STR data. The difference between STR and dPCR quantification is plotted against their mean. Ninety-five percent limits of agreement have been computed by average difference ±1.96× standard deviation (SD) of difference.

