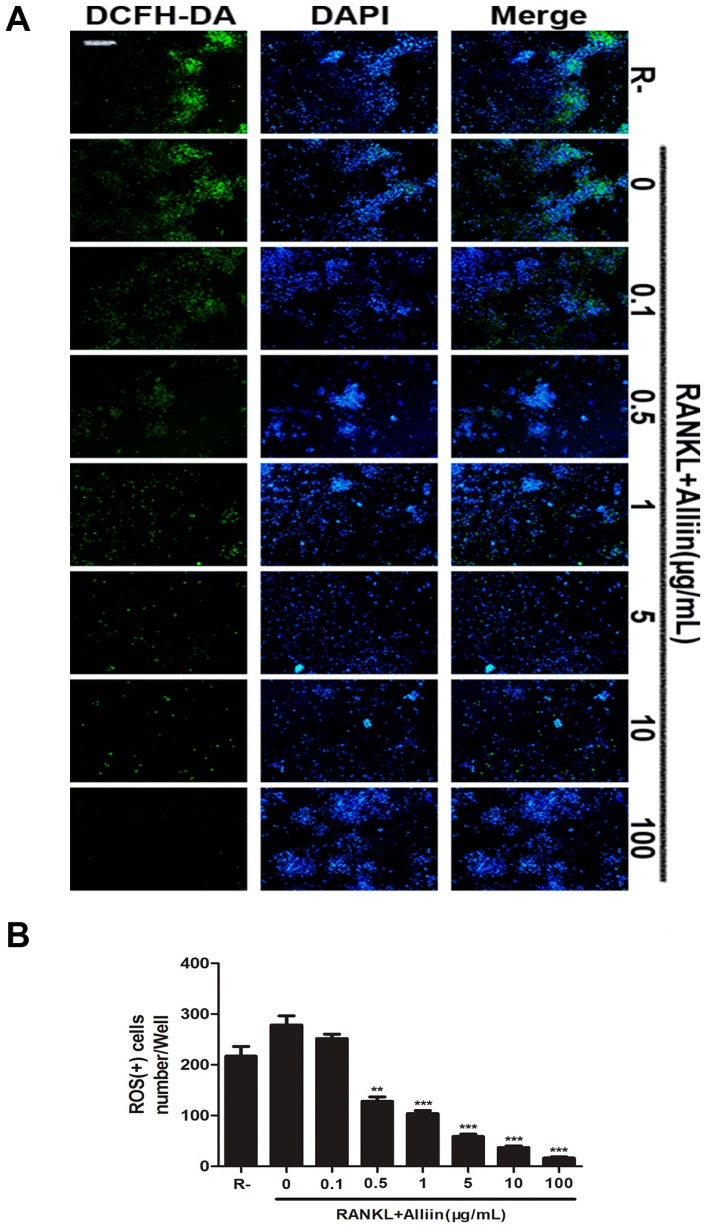
Figure 5.
Alliin scavenged ROS production in a dose-dependent way. (A) ROS detection by fluorescent probe DCFH-DA. Scale bar represents 200 µm; and (B) quantitative analysis of ROS (+) cells in each well (96-well plate). Data in the figures represent the mean ± SD. ** (p-value < 0.01) and *** (p-value < 0.001) based on one way ANOVA.

