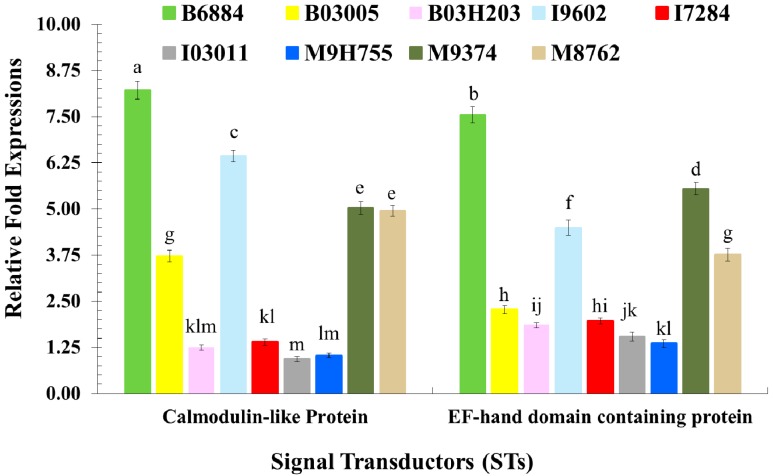
Figure 4.
Relative fold-expression of signal transductors of Rhynchophorus ferrugineus larvae in response to fungal infections using quantitative real-time PCR. Means ± SE values followed by different letter(s) are significantly different. (Fisher’s Least Significant Difference (LSD) test, α = 0.05).

