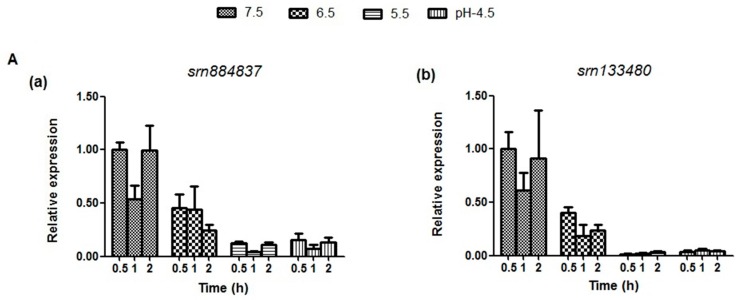
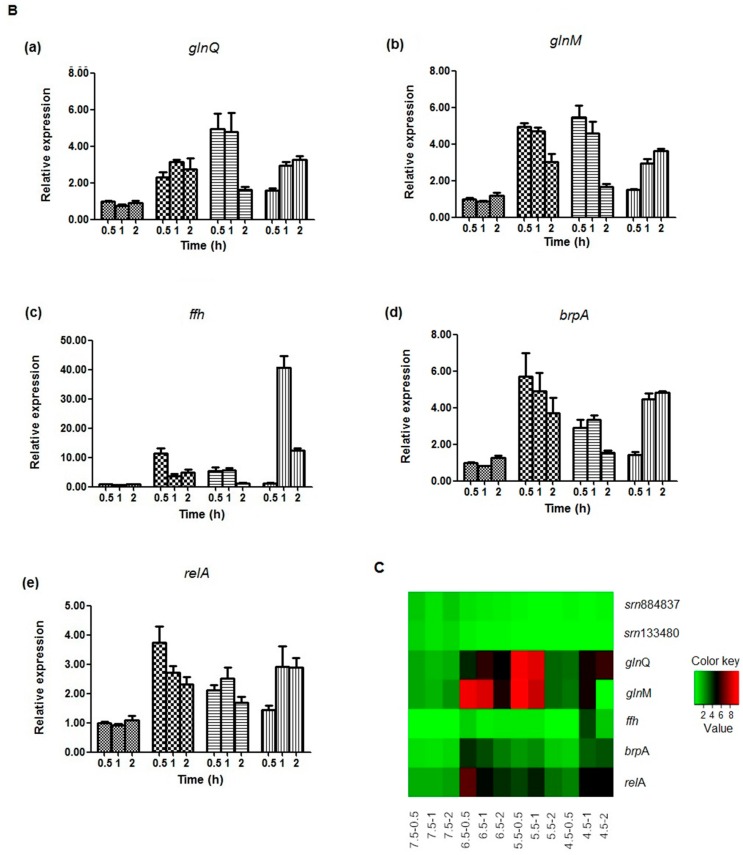
Figure 4.
qRT-PCR analysis of sRNAs (srn884837 and srn133480) and target mRNAs (glnQ, glnM, ffh, brpA, relA) under different acid stress conditions. (A) (a,b) present the expression levels of srn884837 and srn133480 in S. mutan, respectively. The expression level of each sRNA after growth at pH 7.5 for 0.5 h is defined as 1.0. The error bars display the standard deviations of three biological replicates. The two sRNAs present relatively lower expression at pH of 5.5 and 4.5 compared at pH 7.5 (p < 0.05 for srn884837 and srn133480 at 0.5, 1, 2 h, respectively). The p-values for comparison of multiple means using Tukey’s honest significant difference (HSD) are detailed in Table S3; (B) (a–e) present the expression levels of the target genes glnQ, glnM, ffh, brpA, and relA, respectively. The expression level of each gene after growth at pH 7.5 for 0.5 h is defined as 1.0. The error bars display the standard deviations of three biological replicates. The target genes present relatively higher expression at pH 5.5 and 4.5 compared with pH 7.5 (p < 0.05 for glnQ, glnM, ffh, brpA, and relA, respectively). The p-values for comparison of multiple means are detailed in Table S3; and (C) a heat map showing the total relative expression patterns of the two sRNAs and five target genes at pH values from 7.5 to 4.5 at each time point. The expression level of srn133480 after growth at pH 7.5 for 0.5 h is defined as 1.0.


