Figure 3.
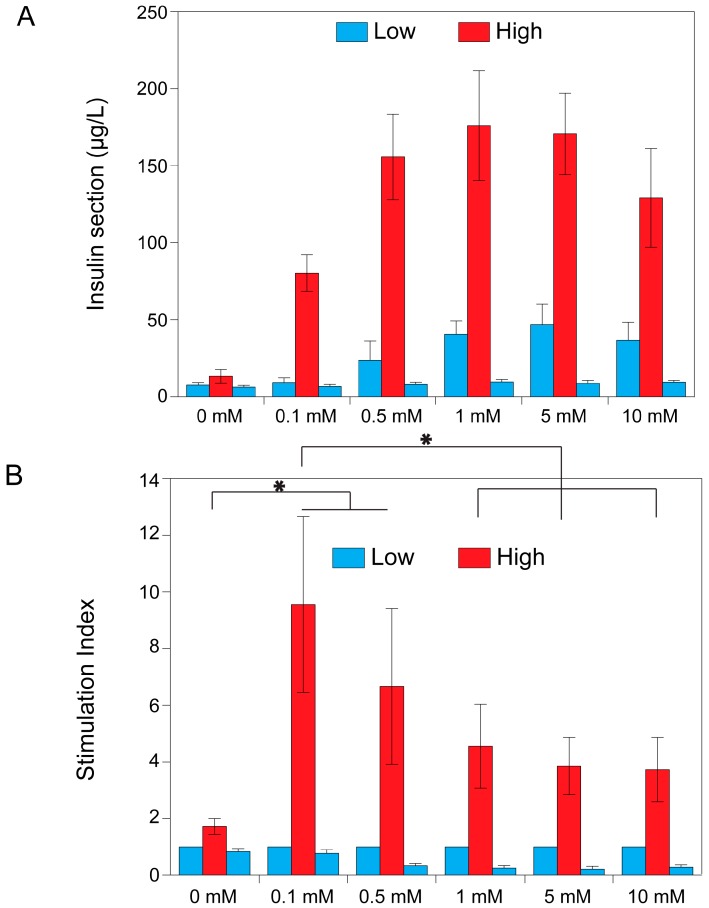
Theophylline concentration-dependent insulin secretion of MIN6 pseudo-islets. Dose-response results of the glucose-induced insulin secretion test on MIN6 pseudo-islets at different concentrations of theophylline. (A) Secreted amount of insulin (µg/L) is shown; in (B) data are normalized by the amount of insulin secreted in low glucose condition (stimulation index). Data are expressed as mean ± standard deviation and significant differences are indicated with * (p ≤ 0.05). Statistical analysis compares the stimulation indices in high glucose conditions.

