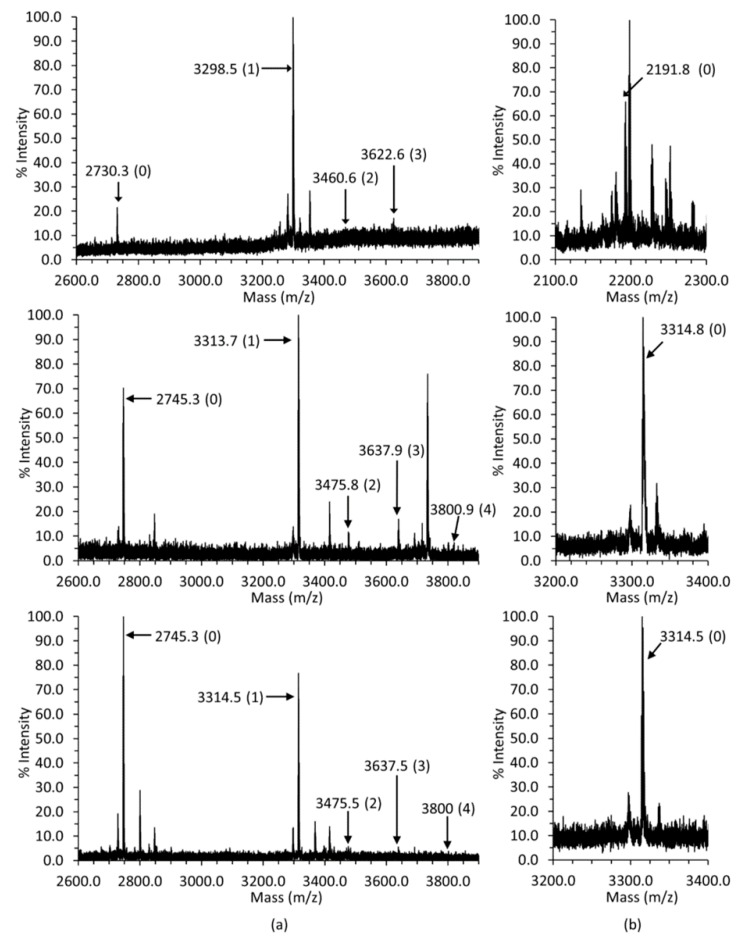
Figure 1.
The mass spectra of bovine (top), mouse (middle) and rat Casq1 (bottom). (a) Calsequestrin 1 (Casq1) glycosylation spectra. The mass of each peak corresponding to either the non-glycosylated peptide or a glycopeptide is labeled, with each mannose contributing an extra 162 m/z. The parenthetical number, (n), associated with each mass indicates the number of mannose present, except the case of the non-glycosylated peptide, which does not have any sugars attached. The GlcNAc2 is implied, i.e., (n) denotes GlcNAc2Man(n); (b) the C-terminal peptide masses. The parenthetical zero indicates no phosphoryls are present. The spectra for the peptides were collected using a 4800 MALDI TOF/TOF Analyzer (Applied Biosystems). All spectra were collected in negative reflector mode.

