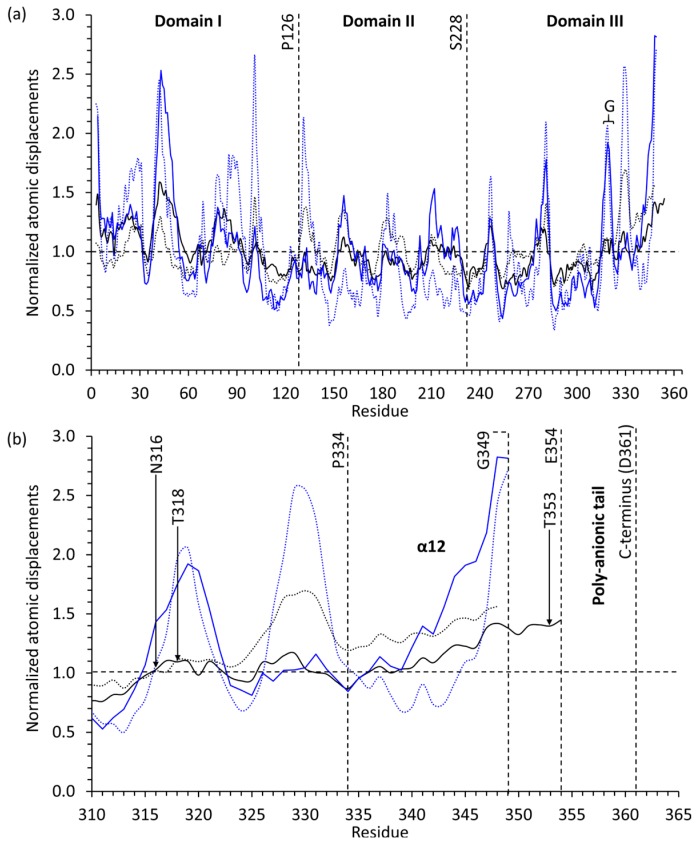
Figure 11.
A plot of protein backbone atomic displacement parameters of the low-Ca2+ (black dashed lines for native, blue dashed lines for recombinant) and high-Ca2+ (black solid lines for native, and blue solid lines for recombinant) structures of native and recombinant bovine Casq1, normalized to their respective mean backbone atomic displacements and averaged for the asymmetric unit. (a) Dashed lines demarcate Domains I, II and III, and residue labels show the terminus of each domain. The letter G marks the location of the glycosylation loop; (b) close up of the 51 terminal residues. N316 is the N-linked glycosylation site; T318 is the terminal residue of the N-linked glycosylation sequence; and Thr353 is the residue seen to be hydrogen bonding with the first GlcNAc of high-Ca2+ native bovine Casq1.

